An economics professor and an engineering professor were walking across campus. The engineering professor spots something lying in the grass – “Look- here’s a $20 bill!” The economist doesn’t bother to look. “It can’t be – somebody would have picked it up.”
This old joke illustrates the philosophical perspective of the economics profession: on balance, people act rationally, immediately and with perfect information, yielding perfect markets. Opportunities will be exploited quickly, and there are no “free lunches” lying around to be eaten.
Old-Fashioned Arbitrage
Of course, if markets are perfect, they are that way because of the rational actions of humans. Suppose crude oil is selling for $42/barrel in Houston, refineries in New Jersey are purchasing deliveries at $49/barrel, and transportation between the two can be had for $5/barrel. Then an enterprising person can (and, according to the perfect market thesis, will) purchase contracts to buy in Houston, contracts to sell in New Jersey, and contracts for transportation, and thus be guaranteed of making money. This is traditional arbitrage. The active pursuit of arbitrage helps bring markets into alignment: it increases demand in Houston, pushing those prices higher, and increases supply in NJ, pushing those prices lower.
Statistical Arbitrage
In the classical scenario just outlined, the arbitrager
- exploits imperfections in the market, and
- assumes no risk – the contracts, if executed at the same time, guarantee their profit.
In “statistical arbitrage” the goal is still to exploit market imperfections, but the imperfections are less obvious: They are uncovered via statistical and machine learning algorithms poring over vast quantities of data, looking for occasional anomalies in established pricing relationships. Exploiting these anomalies yields profit only on average; it is not guaranteed to generate profit for each trade.
One common statistical arbitrage technique is trading in pairs. Find two securities (say American Airlines and United Airlines) that typically trade in tandem, as measured by their covariance or some other metric. Then establish a rule that sells one and buys the other when the prices get out of line, as measured by some benchmark (e.g. “buy American (and sell United) if American moves up only half as far as United moves” on a given day). Statistical learning algorithms discover rules like this, and less obvious ones, that yield profit sufficiently often to be profitable on balance.
There is some degree of random noise in stock data; indeed the “noisiest” noise constitutes the anomalies that are the basis for arbitrage. However, it is still noise, so this approach cannot guarantee a profit each time. Moreover, the big anomalies that come close to guaranteeing a profit on each trade are found very quickly. Further exploitation of anomalies means the arbitrager must be willing to accept smaller anomalies and a greater degree of risk.
One such risk is that a departure from normal – i.e. the normal tandem trading pattern – actually reflects some real change in the status of the two assets, e.g. a pilot strike at a regional airline that feeds United more than American. Betting that a drop in United’s stock price in such a case will be a temporary anomaly would be a losing bet. (Of course, your bet could be entirely “rational” and the timeframe could be off, or, very commonly, other investors’ reactions could be entirely irrational. It is a sad truism that the market can remain irrational longer than most investors can remain solvent.)
Working Harder to Find Profit – Quants
The “pairs” rule is sufficiently obvious that it could almost be implemented manually. Statistical arbitrage took off when it started identifying trades whose basis was not obvious. For example, one quantitative fund (quant) found its machine learning algorithms making offsetting commodity trades on Monday and Friday. After some investigation, the fund’s managers, curious about the repeated computer-driven trading pattern, learned that some commodity traders did not like to be left exposed with large positions on weekends (when they could not trade), so they lightened their holdings on Fridays, only to immediately rebuild them Monday morning. The quant fund’s algorithm profited by taking advantage of the Friday price drop and Monday price uptick.
Quant Fund Popularity
Morgan Stanley pioneered the “pairs” approach to trading in the 1980’s, and it remained out of view until the 1990’s when the internet made investment information more widely available. John Elder, Founder of Elder Research, was an early practitioner of less transparent statistical approaches to investing, helping to create a fund in 1995 based on several years of successful internal trading. The quant fund outperformed the S&P 500 and the Russell 2000, and had higher return and lower risk every year of the decade:
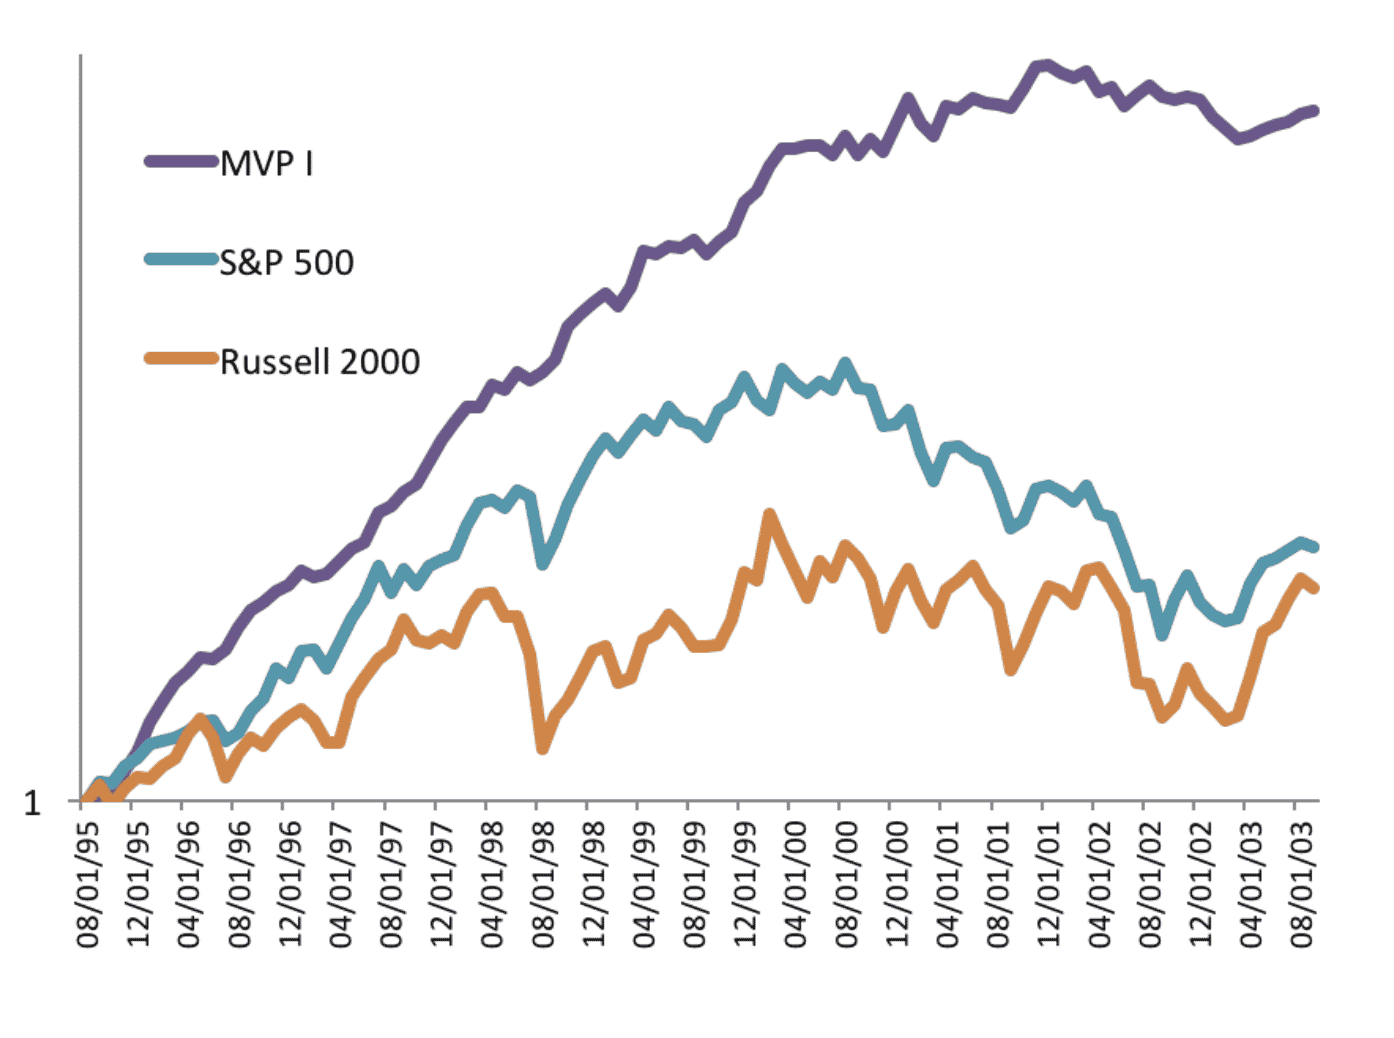
Figure 1: Elder Research guided Fund (MVP) and Two Market Benchmarks (log scale)
Elder Research since turned its attention to consulting and advising, though it remains involved in hedge fund investing.
Also in the 1990’s, Jim Simons and his firm Renaissance Technologies became the foremost practitioner of purely statistical trading techniques, producing returns that were well above market benchmarks. Simons was a mathematician and based his investing approach on machine learning techniques to uncover short-term anomalies in pricing. Speed and volume were the key; risk was minimized by keeping holdings short term. Simons shared next to nothing with the public concerning his methods, other than to say that his trades made money only just over 50% of the time. This may have been a colloquial way of saying that individual trades had an expected value just in excess of their cost (rather than a pure probability estimate). Simons hired other mathematicians and computer programmers; he did not value traditional investing professionals with market knowledge. Simons’ co-president, Robert Mercer, attained political notoriety when he became the largest funder of the Trump campaign (whereas Simons financed mostly Democrats).
Chart Traders
Quants overlap slightly with another group of “non-fundamentals” traders: technical traders who purport to predict future stock movements from past trends. They examine charts of historical price trends and place them into different categories, that are then used to “predict” future prices. There is a resemblance to quantitative trading, in that patterns are detected in data that can be used for prediction. The resemblance is superficial, however – the detecting of the patterns is done heuristically by humans and is not generally derived from statistical analysis.
Julian Simon, the economist and demographer who became famous as a promoter of the “cornucopian” theory of human progress, as contrasted with the “resource exhaustion” school, once found himself lecturing to a group of commodities traders who swore by trading charts. As part of a classroom exercise in which they bet small amounts of money, Simon showed them this chart:
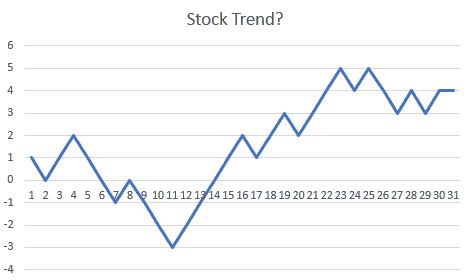
Figure 2.
The commodity traders perked up and began animatedly discussing which classic pattern the chart belonged to (“ascending triangle,” “descending triangle,” “pennant,” etc.). After 15 minutes of discussion, Simon told them that this was not a security or commodity price at all, but a chart of coin flips. “Heads” and the line goes up one tick, “tails” and the line goes down one tick. The traders did not skip a beat – they insisted that
- Coin flips, too, fell into these predictive patterns, and
- The betting game should continue.
This exercise illustrates the danger of over-interpreting chance events as something real. Machine learning predictive modeling can fall prey to this tendency as well, but protections can be incorporated to test the “signals” that the model is thinking it is finding.
John Elder invented one such protection – target shuffling (inspired by what he learned about resampling from Simon and me, he says, before the founding of Statistics.com decades ago). The idea is to shuffle the target decision (action of a trade) across all the possible alternative times it could’ve been made, to create alternative trade histories. If the randomly shuffled outcomes often do as well as the model, or better, then the model is not that worthwhile. It was target shuffling that called both the beginning and the end to the MVP fund, it turns out. That is, his technique was necessary to prove to his client that the pattern he’d found and used in early trading results was finding a lasting “pocket of inefficiency” in the market. It showed that the first year’s strong results (prior to what is shown in the chart above) had only a 1.5% chance of happening by chance alone. That proved more understandable to the decision maker than t-tests, etc. and convinced the client to put real assets behind the business. Likewise, as the profits grew, but the “edge” of the continuously-updated models dimmed over the ensuing decade, target shuffling revealed when it would be good to halt, and the hedge fund ended with all investors coming out ahead – not the normal way hedge funds shut down!
Stable Process Needed
Being fooled by chance is one risk of automated trading. Another risk is that the world will depart from the stable system that produced the automated rules. The machine learning algorithms that learn reliable rules and vet them to be sure they are for real, and not the product of chance, require a market system that is relatively stable so that anomalies can be identified and tested. If a major market upheaval occurs, automated algorithms can run off the rails, unless these sorts of market breaks are part of the learning process.
Conclusion
The explosion of computing power has produced more and more actors in the statistical arbitrage business, and the profitable opportunities have become smaller and harder to find. The $20 bills lying in the grass have, indeed, mostly been picked up. Renaissance Technologies is still going strong with its own internal trading fund, but the returns on its much larger equities fund that is open to public investors are much smaller – closer to what one might get with competitors. The valuable arbitrage opportunities that underlie its own internal fund are not plentiful enough to expand them to the unwashed public. Most academic research on statistical arbitrage trading strategies conclude that there are, indeed, market imperfections to be taken advantage of, but they are small enough that the cost of profiting from them (including the fund managers’ fees) eats up most of the gain, and public investors stand to gain little. Even those who believe they have seen predictable market inefficiencies in the past agree that it has never been more difficult to discern luck from skill; the traps of over-search and over-fit are ever-present in the massive competitive ensemble that is the markets.