Perhaps the most active application of analytics and data mining is healthcare. This week we look at one success story, the use of machine learning to predict diabetic retinopathy, one story of disappointment, the use of genetic testing in a puzzling disease, and a basic dichotomy in statistical analysis.
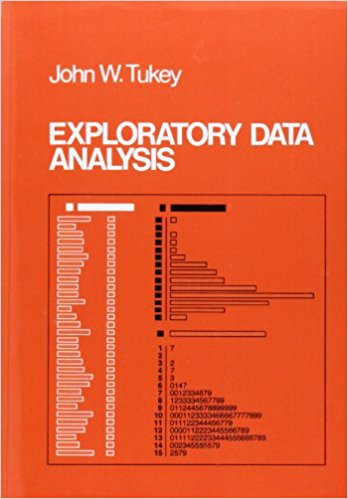
In his famous 1977 book that introduced the idea of exploratory data analysis, John Tukey described two different strands of statistical analysis:
-
Exploration
-
Confirmation
Tukey’s book, Exploratory Data Analysis, elevated the role of exploration, and he established the role of “data analyst” as opposed to statistician. Tukey was concerned with numerical summaries and plotting techniques that both simplify the story behind the data, and dig deeper to add understanding. Those techniques took on a vibrant life in statistics, particularly the plotting techniques that laid the foundation for the rich toolkit of data visualization techniques that is now available. He applied the term “confirmatory analysis” to the whole arena of statistical inference, with its complex set of formulas for hypothesis testing and confidence intervals.
Exploration is the process of looking at data in lots of different ways to see if there’s anything interesting going on. Confirmation is the process of validating that you’ve found something real, and not just random behavior. The best way to do this is to look at new data and see if the phenomenon holds up. We’ll keep this distinction in mind as we look at two cases in healthcare.
Diabetic Retinopathy and Deep Learning
Diabetes is the fastest growing cause of blindness. Over 400 million people worldwide have diabetes and are at risk for diabetic retinopathy and possible blindness. Diabetics are most likely to be on a regimen of regular monitoring of blood sugar, and frequent eye exams. Retinopathy, however, cannot be diagnosed with a quick exam of the eye; images must be taken and examined by a specialist – and in many parts of the world these specialists are few and far between. By the time image has been reviewed and diagnosed, the patient will have left the clinic, and the odds of getting them on an appropriate therapy regimen have plummeted.
In 2016, a team of researchers from Google and several universities published the results of a study in which deep learning was used to classify eye images and assign a probability of retinopathy, which was converted to a diagnosis by setting a cutoff point. This challenge had earlier been the subject of a Kaggle competition; the Google team, using those results as a point of departure, brought in more data and achieved results equivalent to those of trained specialists. Considering that a consensus of specialist evaluations was the basis for “ground truth” in the study, these are good results indeed.
This study was not an exploratory one; the goal was not to locate factors that might be associated with retinopathy. The purpose apriori was simply to identify retinopathy. The images were all labeled as to whether disease was present, and a holdout set was used to evaluate the algorithm, to be sure it was not finding chance artifacts.
The medical implications of the study are important – when the system is implemented, images can be evaluated immediately while the patient is in the clinic, and an appropriate therapy regimen started before the patient leaves.
Genetic Testing
The human genome was mapped in 2003, and the last 5 years have seen explosive growth in a completely new business – genetic tests. There are now over 75,000 such tests relating to different genes, and the race is on to find out what genes are associated with what disorders. There are close to 20,000 genes, and the tests typically focus on specific sets of genes in connection with particular disorders. This broad-scale undertaking is not a focused confirmatory study, it is exploration on a massive scale to find interesting correlations between genes, particularly genetic mutations, and diseases. There is little hope that targeted specific confirmatory studies (which can be expensive) will catch up to all the suggestions unearthed by the widespread genetic testing. In short, it is a recipe for lots of false positives.
This effect is illustrated in a Wall Street Journal story about a 4-year-old girl – Esme – afflicted with an unknown but debilitating circulatory and respiratory ailment. A genetic test in 2013 revealed a defect in the PCDH19 gene. The family dove deeply into research, and engagement with a small community of those suffering a similar defect. They established a foundation to fund research into PCDH19 defects. But in 2015, another genetic test suggested that PCDH19 was not at fault, rather SCN8A was the culprit. The family shifted their foundation’s research over to SCN8A. In 2016, the lab that did the 2015 testing issued a reinterpretation of the prior results. SCN8A’s significance was now considered uncertain, and two new gene variants were implicated. A few months ago, the lab again contacted the parents with word that a new test was available, incorporating the latest information. The repeating cycle of hopes raised and then dashed, pathways opened then closed, has been discouraging and draining for the parents.
The ability to process huge data sets and conduct exploratory statistical analysis “at volume,” leads to a proliferation of “findings” that are tantalizing but ephemeral. The significance of a “finding” is inverse to the amount of searching that had to take place to produce it. John Elder, the founder of the highly-regarded specialty data mining firm Elder Research, terms this the “vast search effect.”
