1.2 million scientific papers were indexed by PubMed in 2011 (see Are Scientists Doing Too Much Research), ample proof that there are lots of people studying the same or similar things. For example, there have been
-
Over 100 studies of suicide following psychiatric institutionalization
-
38 studies of whether e-cigarettes help you quit smoking – 38 studies
-
18 studies of why people give their dogs up to shelters
-
Over 30 studies of reading on paper versus reading on screen
Often the individual studies are weak or inconclusive, or conflict with one another. A meta-analysis is an attempt to bring together different studies on the same subject and form a consolidated conclusion. The conclusion will also have much greater statistical power due to the greater numbers. For example, in the meta-analysis of suicide following psychiatric institutionalization, the aggregate from the individual studies totaled 17,857 suicides during 4,725,445 person-years.
To avoid comparing apples and oranges, meta-analyses can only compare like with like, so not all studies on a topic can be folded in. The e-cigarette study winnowed 38 studies down to 20, and reached the (perhaps surprising) conclusion that e-cigarette use reduced the likelihood of quitting smoking – that odds of quitting smoking were 28 percent lower in smokers who used e-cigarettes compared to those who did not. The paper vrs. digital reading study found that reading performance was better with paper books, as opposed to digital books, but that this effect was limited to “expository” texts (textbooks, articles trying to convey information or make a point). For “narrative” texts (i.e. stories), people did just as well with digital as paper.
Meta-analysis is typically a part (an important part) of a systematic review. In a systematic review, published empirical evidence on a research question is collected according to defined criteria, to facilitate a “consolidated” answer to the question. Systematic reviews of similar quantitative sample-based studies typically involve a formal meta-analysis to yield a single effect size, or estimate. Meta-analysis began to be practiced widely in the 1970’s, and the development of the internet and cloud hosting of studies has made it much easier to conduct the wide literature searches required.
What are some key points in a meta-analysis?
Collect prior studies according to pre-defined criteria. The criteria are generally those that mark a sound empirical quantitative study – control of bias and confounding, randomization of subjects, use of controls, reproducibility, availability of data, amenability to summary in a single finding or estimate. Not all these criteria are always met. For example, data are often not published, though the availability of all study data for aggregation at the granular level, rather than the data summary level, is considered the “gold standard” of meta analysis.
Decide on the summary statistic. For continuous data, this is usually the standardized difference in means (Hedges g). For binary outcomes, it is usually relative risk, or the odds ratio.
Weight the studies and calculate the overall weighted estimate. The studies that make up the meta-analysis will differ in size and quality, and should be weighted accordingly. They are typically weighted by the inverse of the within-group variance for each study.
Assess the standard error of the estimate. If you can assume that the true underlying effect size is the same across all studies – a “fixed effect” model – the estimation of the standard error takes account only of the variance within each individual study. This assumption may be unwarranted – for example, the positive impact of a therapy may be different in a study involving younger people versus older people. If the true effect size may differ from one study to another – a random effects model – then the standard error of the estimate must incorporate both the within study variance and the variance from study to study.
Study any heterogeneity among studies. Real differences from one study to another – heterogeneity – result in confidence in the precision of any overall estimate. However, they are also an opportunity to learn more about why the studies differ. A study of heterogeneity will therefore attempt to understand what might be real differences, and what might be the product of random variation.
How to present meta-analysis
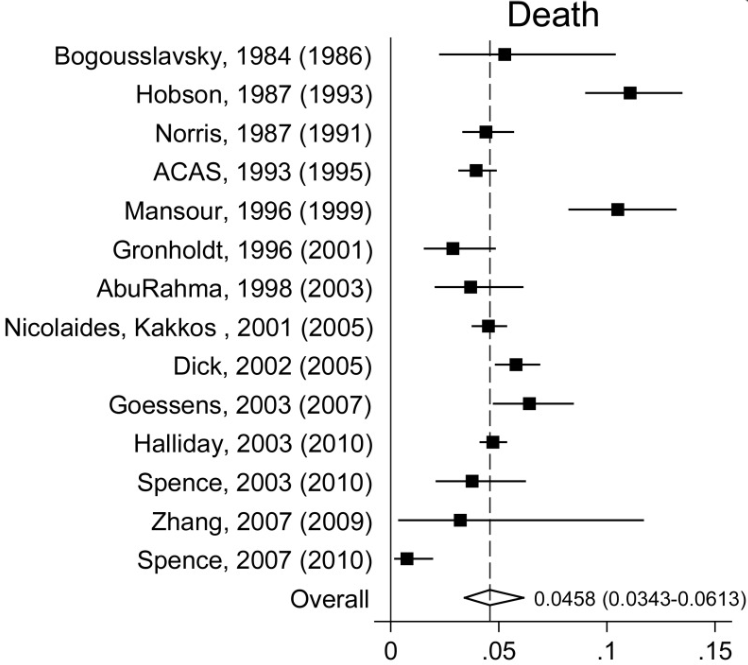
A useful presentation of a meta-analysis is a forest plot of the individual constituent studies with their individual effects and confidence intervals and the overall summary effect at the bottom, as in this example of studies of treatment of carotid stenosis from an NIH publication:
The above is a very high level overview (see this NIH review for more); considerable calculation is involved, particularly in the assessment of heterogeneity. Special purpose software is helpful for that. There can be complexities such as studies that involve subgroups, multiple outcomes, or phased outcomes.
You can learn more in our three courses on meta-analysis:
- Meta-Analysis – the foundations, using special purpose software
- Meta Analysis In R – the foundations using R
- Meta-Analysis 2 – going beyond the basics, using special purpose software