Prepared by Peter Bruce, Mark Smith and Ramon Perez, this case study was originally published at elderresearch.com.
In early 2020, Sira-Kvina Kraftselskap, a large producer of hydroelectric power in Norway, suffered a breakdownof one of its major generators. Company technicians went through established diagnostics to identify the cause, but they were unable to pinpoint the trouble. Efforts to restart the generator continued to fail and the shutdown dragged on for months.
Sira-Kvina turned to Elder Research (ERI) which, coincidentally, was already working with the company on a project to build machine learning models to better predict failures. Essentially, they said “Our standard checklists of component performance haven’t found the problem. How about taking a look at the data to see if you can find the cause?”
There was, indeed, plenty of data –far too much to review manually. There were hundreds of sensors that produced minute-by-minute readings on the bearings, rotors, turbines, subcomponents, and more. ERI investigated the data leading up to the failure with a view to finding any unusual statistical changes that might indicate the cause. The raw minute-level data was very noisy, so data was grouped into power cycles (the time from power-on to power-off) and summarized by features –e.g. mean temperature in cycle –to capture the sensor behavior.
At first glance, nothing stood out. The noise in the data was expected, given the level of granularity at which they were working. It was not until the analysts began to look at changes in variability across time that a picture began to emerge. Variability of a sensor in a cycle was summarized by the “lumpiness” feature, defined as the variance of the variance across time windows. Inspecting by eye how lumpiness changed leading up to the failure (see Figure 1),they found an interesting pattern in the temperature sensor for the upper guide bearing of the shaft that connects the generator to the turbine:a flat period throughmost of the power cycles, then an ascending series of spikes, culminating in a high peak at the time of failure (the vertical dotted line towards the right). Failures tend to develop over time and so naturally the question arose as to whether the spikes capture symptoms leading up to the failure?
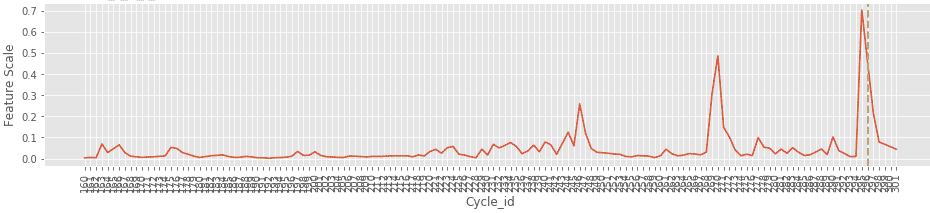
Figure 1: “Lumpiness” (y-axis) plotted sequentially over time, by power cycle
While not directly informative, this plot was a key clue. It pointed the team in the direction of temperature as an issue, and suggested another review tactic:zoom into the cycle where the large pre-failure spike occurred, and look at the raw minute-by-minute temperature readings (see Figure 2). Here they found an apparent anomaly for the bearing sensor (cycle ID 295 below).
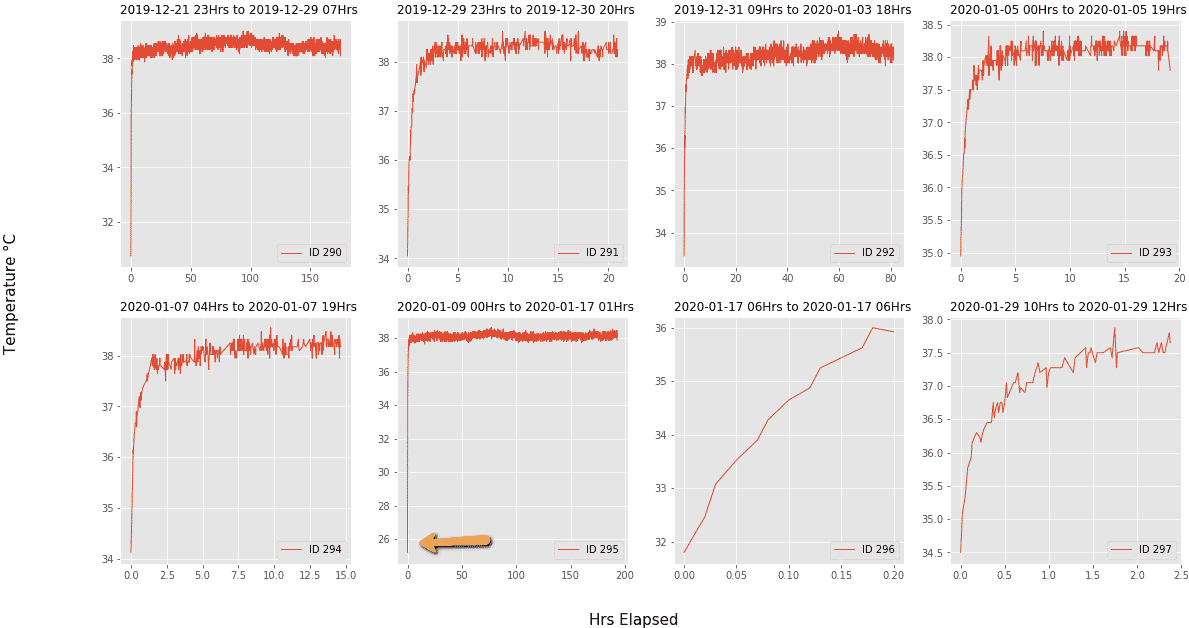
Figure 2: Bearing sensor temperature; x-axis is hours elapsed in the power cycle
Consider the plot on the lower right (Cycle 295). The starting temperature (just over 25 ºC) for this sensor on this power cycle was considerably lower than the starting temperature on the others (31-34). (Note that the plot shapes differ in other ways, but that is due to the different scales on the x-axes.)
The data science team zoomed in a step further and was able to confirm that this temperature jump of 13 degrees from startup to regular operating temperature was well outside the normal range of temperature jumps (median cycle temp minus start-up temp). Figure 3 shows the distribution of the temperature jump over all power-cycles, allowing a comparison of the typical jump to the pre-failure jump for this sensor. The cycle of interest is the outlier (dotted line) on the far right, which shows this observation to be significantly high.
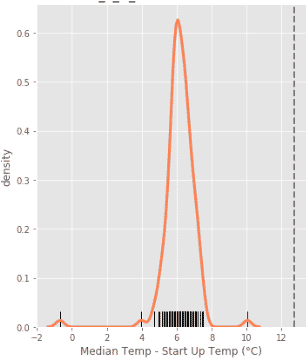
Figure 3: Temperature jump over all power cycles
Other sensors showed a similar pattern. Elder Research brought these statistical findings to the experts at Sira-Kvina, who found the following:
- Vibration level was 30% higher in the case where the cold start was present. Vibrations cause stress on the components.
- Generator heaters were suspected to have not been working properly, causing the cold start.
- This cold start was proven to be the culprit in causing this massive, extremely expensive generator failure
Understanding the cause was very valuable to Sira-Kvina, not just in identifying this particular failure, but also in providing the methodology that will help prevent such costly and time-consuming faults like this in the future.
Summary
The standard industry logs and checklists did not provide the flexibility and granularity to quickly locate the generator fault. Only after the data was “mined” and analyzed, in a combination of automated and human expert review, was the fault pinpointed.Sira-Kvina was sufficiently impressed that they committed even more deeply to the data-driven approach to preventive maintenance that ERI was already developing for them