Researchers and analysts are familiar with the famous 5% benchmark in statistics, the typical probability threshold at which a result becomes statistically significant. (The probability in question is the probability that a result as interesting as the real-life result will happen in the null model.) This week we look at some interesting 80% rules.
Pareto’s 80%
The most popular 80% rule is the Pareto Rule, which states, in general, that “80% of the _____ is accounted for by 20% of the _____.” It is really more of a symbolic expression than a hard and fast rule. Some popular Pareto rules:
- Healthcare: “80% of the costs in healthcare are accounted for by 20% of the patients”
- Business: “80% of the sales come from 20% of the clients”
- Baseball: “80% of the Wins-Above-Replacement come from 20% of the players” (the Wins-Above-Replacement statistic measures the contribution of a player to a season’s wins, compared to an average substitute player)
- Law Enforcement: “80% of the crimes are committed by 20% of the criminals”
Is the 80-20 rule a law of nature? Some reflection on the business sales scenario tells us otherwise: Tesla, a company that primarily sells one vehicle per customer would have a very different ratio from Spirit Aerosystems, which makes airframes for Boeing and Airbus. The Pareto rule is so well known that it is arbitrarily used and misused in all sorts of scenarios: one article claims that 80% of one’s needs in a romantic relationship can be supplied by the partnership, the remaining 20% must come from the individual.
Perhaps the most famous Pareto rule has been applied to income distribution: 20% of the people have 80% of the income or wealth. But this percentage varies significantly over time and across countries; in the U.S. today it is closer to 10% and 90%. So the Pareto rule is not an immutable law; rather it is a useful way to communicate that frequency distributions encountered in the wild are often skewed. The technical definition of skew
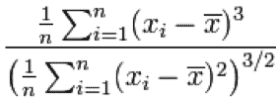
would not pack the same punch as the 80-20 rule with most people (even statistically-literate analysts).
Vilfredo Pareto was an Italian polymath (1848-1923) who observed that 80% of the wealth in Italy belonged to 20% of the population.
Vilfredo Pareto
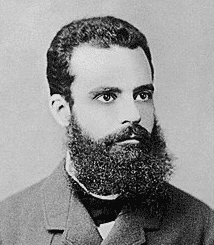
He was also the origin of the concept of Pareto efficiency (or Pareto optimality) in economics that has been central in the development of market-based theories in microeconomics. Pareto efficiency in economics is a state in which nobody can be made better off without making someone else worse off. Voluntary market transactions are the mechanism by which Pareto efficiency is achieved.
Pareto’s 80-20 rule as applied to business management was popularized by Joseph Juran (1904 – 2008).
Joseph Juran
 Juran, along with W. Edwards Deming, is regarded as the founder of the quality management movement. His widely-cited Pareto rule is that 80% of quality problems result from 20% of the causes.
Statistical Power
Returning to statistical inference brings us the next 80% example: power and sample size analysis. Power is the ability of an experiment or comparison to detect an effect of interest. More precisely, it is the probability that an effect size of interest, say, a 50% decline in infections (the goal in Covid vaccine studies), will be detected by an experiment, if the effect exists.
There are four moving parts in power and sample size analysis:
- Alpha: the probability level (p-value) at which the experiment’s hypothesis will be deemed “significant”
- Sample size
- Effect size: the true impact of a treatment (decrease in deaths, increase in crop yield, boost in web clicks, etc.)
- Power – the probability of detecting the effect
Set three of the above, and the fourth is determined as well. Investigators must balance them. Typically, investigators are interested mainly in solving for sample size – “How many subjects do I need for my study?” – and effect size “How small an effect can I detect?” Alpha is typically set at 0.05. Typical values for power are 0.9 and 0.8, but more often the latter since it allows you to use a smaller sample in search of a given effect size. Or, alternatively, for a given sample size you can detect a smaller effect.
If the costs of gathering study subjects were minimal, researchers would opt for 90% power all the time. But researchers usually settle on 80% power, probably because the cost either of gathering more subjects or requiring a bigger effect size are concrete and unpleasant, while the loss in power is a bit more abstract.
80% in Hiring Discrimination
In 1971, a State of California employment advisory group proposed a test of employment discrimination which became known as the “80% rule.” This rule established a standard of proportionally equal hiring from protected groups (African Americans and other minorities) and the dominant group (typically white males). Let’s say a company, over a given time period, hired 20 of 50 Black applicants (40%) and 40 of 80 White applicants (50%). The resulting ratio of proportions, 40%/50% is 80%, and thus the company meets the 80% standard, just barely.
Later, more complex tests of statistical significance (i.e. departure from what random chance selection would produce) became part of the calculus. So did considerations of job requirements that were relevant for job performance but, nonetheless, had a discriminatory impact.
“Disparate impact,” the issue of whether imbalance in hiring (or housing, school admissions, or other areas) by itself is sufficient to demonstrate discrimination is a complex and controversial subject in law. The involvement of legislative bodies, courts at all levels, regulatory agencies, and the constitution itself (the equal protection provisions of the 14th amendment) ensures fertile ground for litigation. The statistical aspects are but one arrow in a lawyer’s quiver.