A researcher shakes a sprig from a Christmas tree, and counts the number of needles that fall. He then repeats the process for countless other sprigs. The sprigs are from a variety of species, and the goal is to determine which species do the best job of retaining their needles. Falling needles are a definite consumer drawback. At a horticultural farm on the campus of Michigan State University, researcher Bert Cregg conducted this, and other experiments (described in this Wired article). He found that Fraser firs and Noble firs were the champs at needle retention. In another experiment, he gathered numerous shoots from different tree species and placed them in a freezer that was programmed to get 3 degrees Celsius colder every hour. Every hour a subset of shoots representing multiple species was withdrawn and incubated for a week, after which they were examined to see whether they had browned (signaling damage). The result was a set of data that could answer two questions:
-
Which tree species were the hardiest?
-
At what temperature did they begin to succumb?
Over 30 million natural Christmas trees are sold every December in the US, with most coming from small farms. Christmas tree production is one of the most decentralized agricultural sectors, in part because small landholders can grow trees to minimize property taxes, while expending little effort compared to growing other things. For some, more revenue may come from tax savings than from sales of trees for some property owners.
Square Tree Data
The fact that the sector is dominated by small actors also means that considerable data is available at much lower cost than in the past. The sellers of Christmas trees often use mobile payment processors like Square, which has been energetic in capturing not just its share of the transaction fees from small scale merchants of all sorts, but also the value from the data.
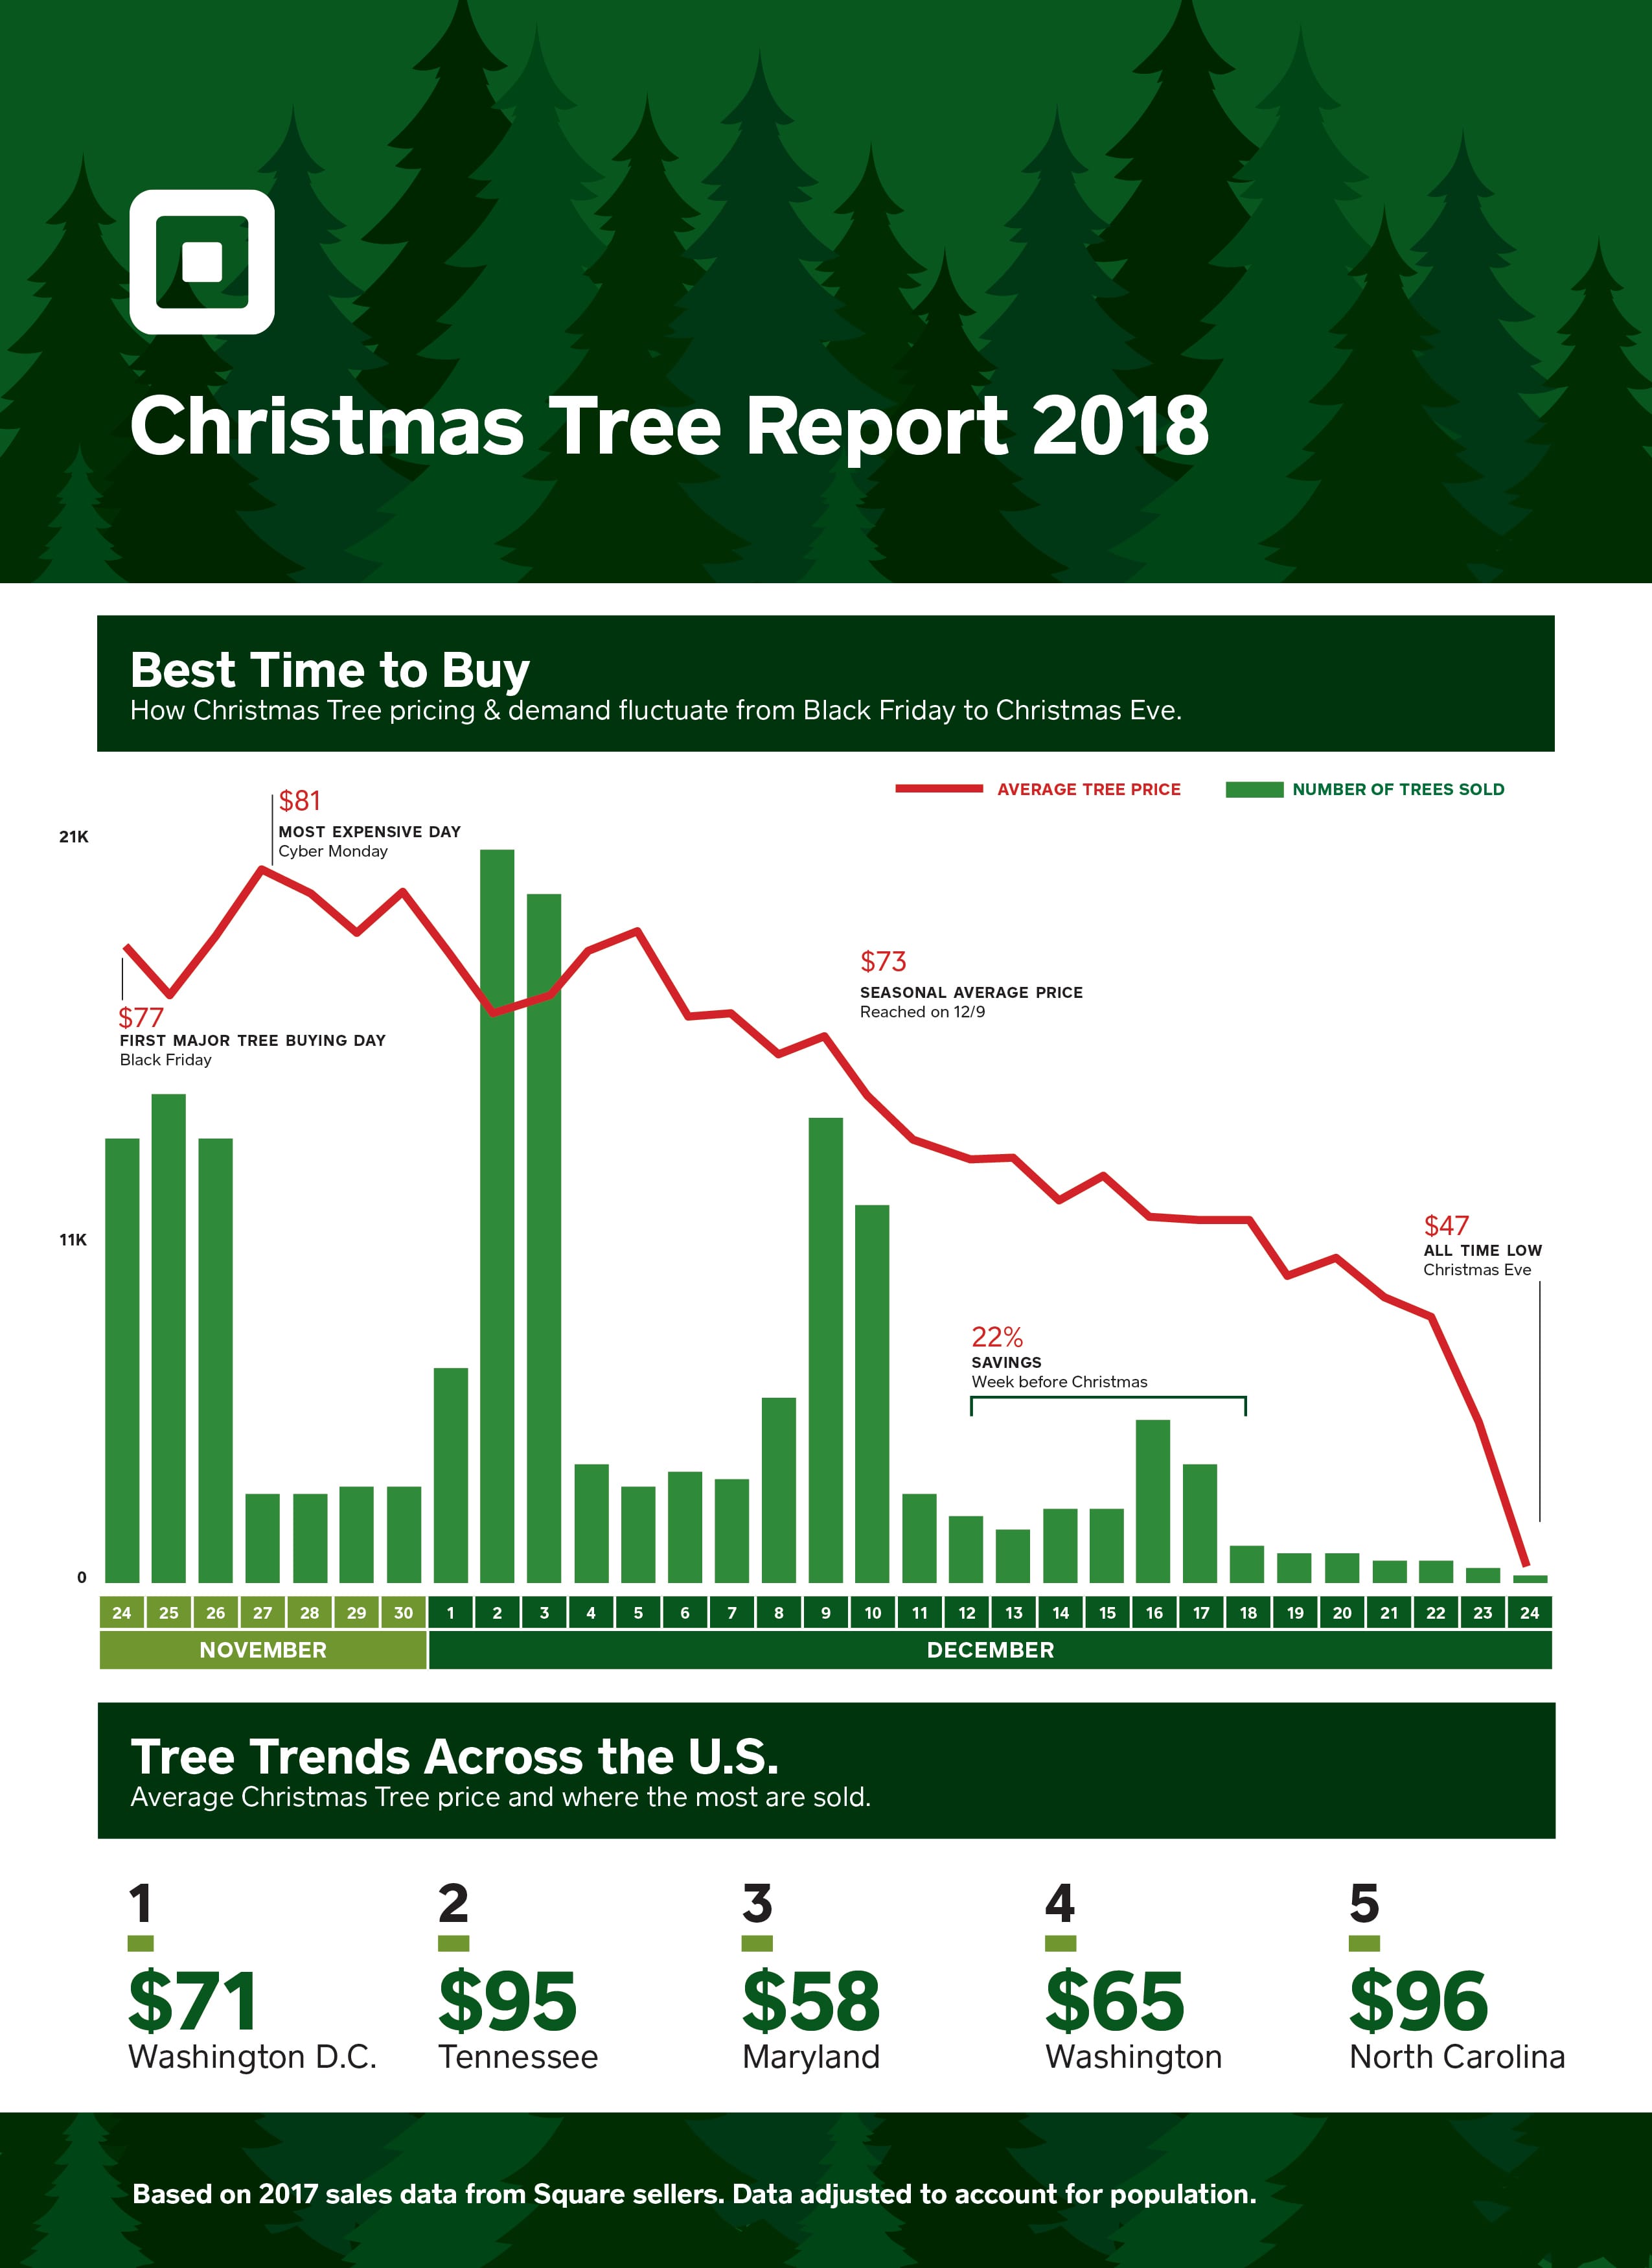
Square reported, for example, that the average 2017 price for a Christmas tree was $73, a 17% increase over 2015. Interestingly, prices were significantly higher in Tennessee ($95) and North Carolina ($96), a bit of a puzzle since these states are major producers. They are also relatively rural – perhaps people in dense urban areas buy smaller trees?
Square also has daily sales data, and reported that the weekend after Thanksgiving is the peak time for price, while the following weekend is the peak time for volume.
Square can put its detailed sales data to work in supporting a revolutionized small loan business. In the old (banking) days, assembling the documentation and talking to a bank about a loan might have required more than six months. Square has several big advantages that let it act almost instantaneously as a lender to its processing customers:
-
It has immediate data in its system on a small business’ sales and finances, just by virtually of processing its credit card data
-
It can automatically feed that data to predictive algorithms to determine the probability that a loan will be repaid
-
It can collect loan repayments by taking a share of the future credit card payments that go through it system
Addendum – 2018
Square’s data is through 2017, and anecdotal information and conversations in the Washington area suggest that trees are smaller and more scarce in 2018. One vendor attributed this to the 2008 recession, in which some farms failed and others failed to plant their usual quota of trees. Since most trees take between 7 and 15 years to come to maturity, the loss of a significant portion of the 10-year-old cohort would put a dent in the market ten years after the recession – in 2018.
Regular Trees
The regular timber industry, by contrast to the Christmas tree sector, features very large companies – companies like Weyerhauser and Georgia Pacific have revenues in the billions of dollars and employees that number in the thousands. They face complex multi-year decisions on what to plant, when to harvest, and what products to produce from the timber. The potential volume of data that might inform the statistics and analytics behind these decisions is enormous – Weyerhauser alone plants roughly 100 million trees per year – and mostly proprietary.
Devices that can collect data at that scale are now here – such as drones, and static imaging scanners that can capture up to 65 million spatial data points in 3 minutes. There is also a specialized platform for housing this data and making it available for analysis – see Treemetrics post The Big Data Challenge for Foresters. The potential applications of statistics and analytics to forestry are numerous.
-
Time series methods combined with predictive analytics can help provide better predictions of harvest yields at various points in the future, and aid in decisions about when to harvest
-
Survival analysis can be used to model deforestation
-
Linear programming and other optimization techniques can be used to recommend the best product mix to produce.
As data-collection devices see greater deployment and use, expect the next big growth spurt to come in the expansion and refinement of analytic methods in the service of tree growing and harvesting.