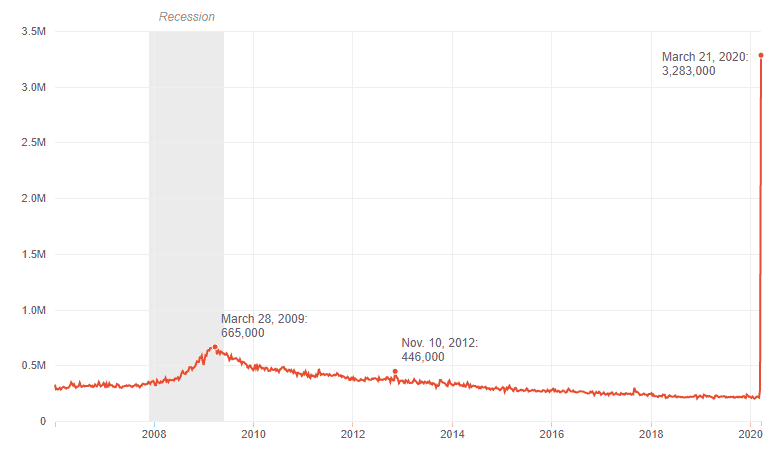
The worldwide Covid recession has led to a dramatic increase in unemployment and, hence, Unemployment Insurance (UI) claims. The figure below, from the U.S. Dept. of Labor (via https://www.npr.org/2020/03/26/821580191/unemployment-claims-expected-to-shatter-records), shows new claims on a weekly basis. Compare the March Covid-related peak on the right to the 2008-9 recession and you can see the unprecedented magnitude of the Covid unemployment spike.
The blossoming of unemployment claims, coupled with the availability of additional federal Covid-related unemployment funds, has led to a parallel bloom in unemployment insurance fraud.
Money Mules
A key actor in unemployment insurance (UI) fraud is the money mule: a person who, perhaps unwittingly, processes electronic monetary transactions on behalf of a criminal enterprise. The role is analogous to that of a drug mule in drug smuggling. Money mules use real personal information stolen in data breaches or by phishing; lots of mules are needed in large-scale UI fraud because the amount to be gained from each UI claim is limited. A Nigerian ring stole close to $500 million in UI funds in the state of Washington alone. The believable claim rationale of Covid-related unemployment and the huge numbers of legitimate claims allows the mule-wranglers to mount large operations amid the semi-chaos. A glance at the unemployment claim data of just one small rural state (Maine) suggests that 1 in 7 claims may be fraudulent.
Catching the Mules
How do you catch the crooks? Given the scale of the crime, analytics and machine learning are key. For example, multiple applicants sharing the same IP address is a signal that criminals may be afoot. Elder Research Inc., our parent company, has developed an analytics tool that can predict the likelihood that an individual claim is fraudulent. An interesting feature of the tool is its easy-to-understand visualization dashboard that assigns summary risk scores to individuals, while at the same time showing what factors contribute to that risk. The blog that follows, by CTO Victor Diloreto, illustrates how to build an effective data science application that combines state of the art machine learning with presentation tools that allow decision-makers to understand what lies behind the risk scores.
New Tool Helps States Reduce Unemployment Insurance Overpayment
By Victor Diloreto, CTO, Elder Research Inc.
(originally published at elderresearch.com)
Elder Research has extensive experience helping enterprises find and eliminate fraud, waste and abuse (FWA). For several state-level labor departments, we have assisted with identifying fraudulent unemployment insurance (UI) claims. This capability is critical today, during the unfortunate record-setting unemployment over the last few months. This blog is dedicated to help agencies – who are wary of domestic and foreign abusers of the UI system – by describing our successful work, where and how it is being used, and how to leverage the lessons learned and tools built to identify FWA.
The Tool – DAPM
The Data Analytics and Predictive Modeling (DAPM) tool combines business rules, mathematical algorithms, and predictive machine learning models to evaluate claims data and assess the risk of overpayment. Because the DAPM tool is designed to be adoptable by any state workforce agency, it uses generally-available UI data sets – claims data, certifications data, employment and income data, etc. – with the vision that states adopting the tool could first implement the core product and then build out functionality specific to their UI landscape. The analytics generated by DAPM are delivered using Elder Research’s RADR, a powerful, server-based, data analytics product fusing data from multiple sources, supporting sophisticated predictive and machine learning risk models, and providing a flexible and intuitive visual interface.
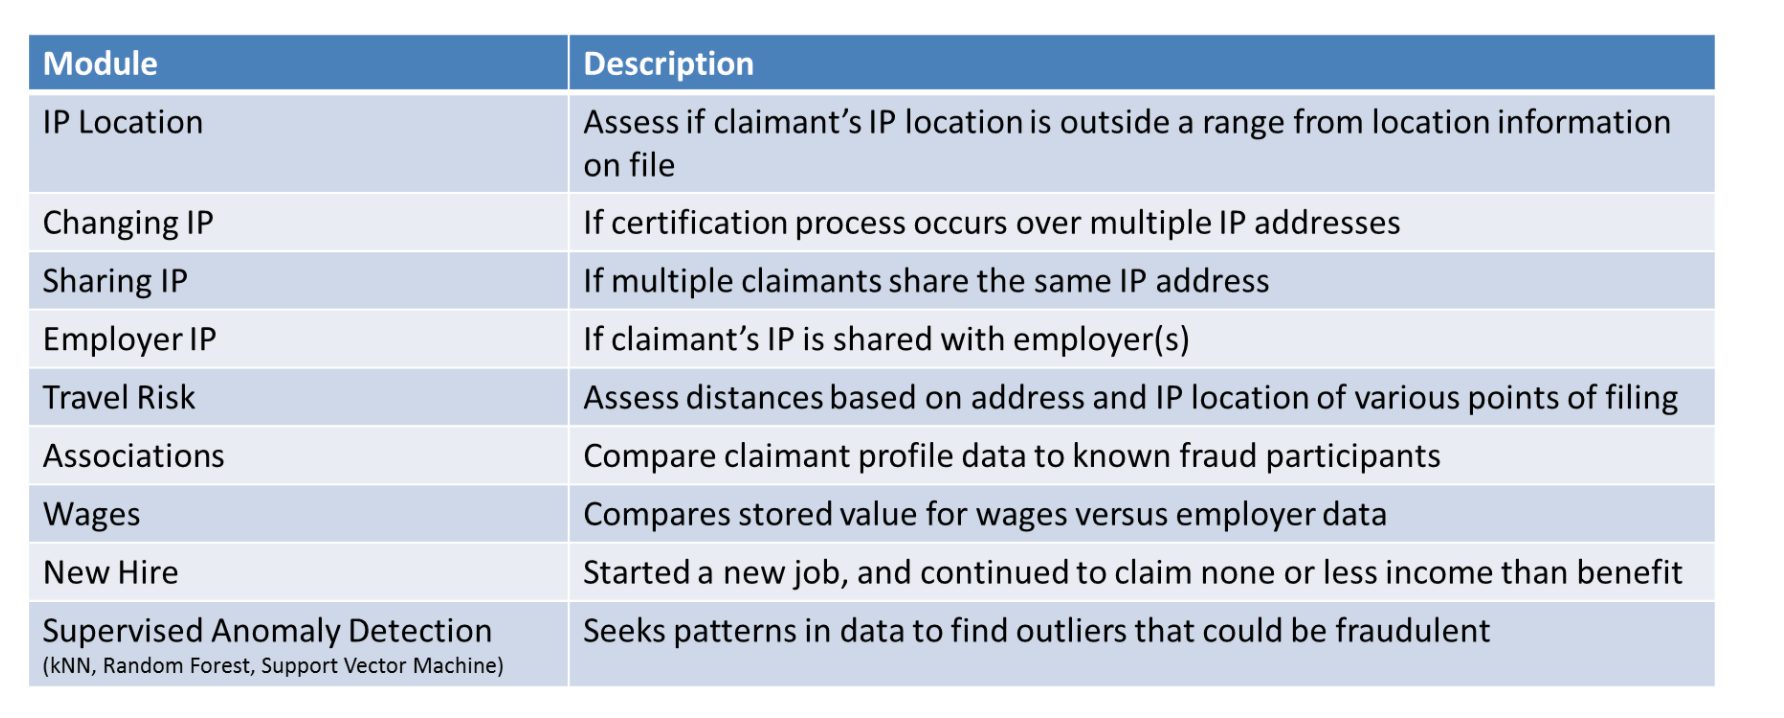
The DAPM analytical modules can be classified into four broad groups:
- IP address-based modules (IP Location, Changing IP, Sharing IP, Travel Risk, Employer IP Sharing Risk)
- Associations to previously flagged claimants module
- Report-based modules (Quarterly Wage Report, National Directory of New Hires)
- Supervised models (k-Nearest Neighbors (kNN), Support Vector Machine, and Random Forest)
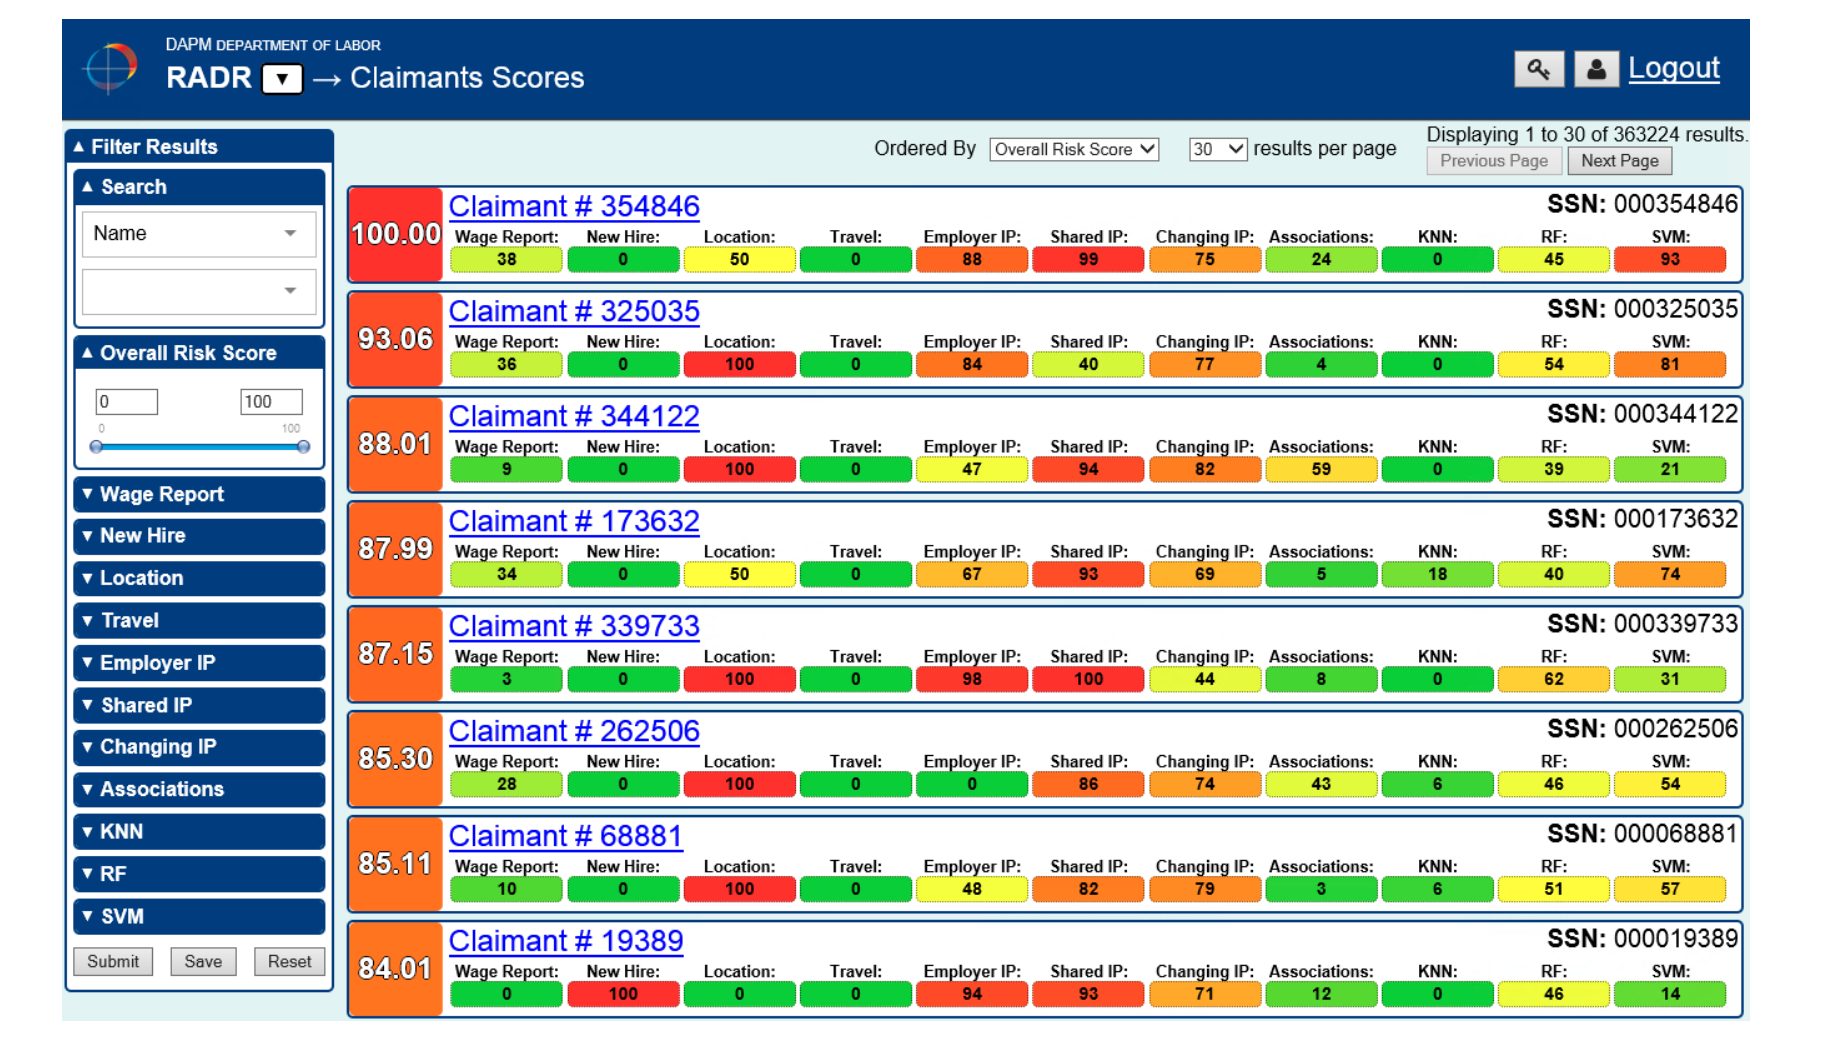
 Each of these modules generates a risk score for each claimant that is aggregated and normalized to a scale of 0 to 100, with low scores meaning it is less likely to be an overpayment and higher scores meaning it is more likely to be an overpayment.
Performance
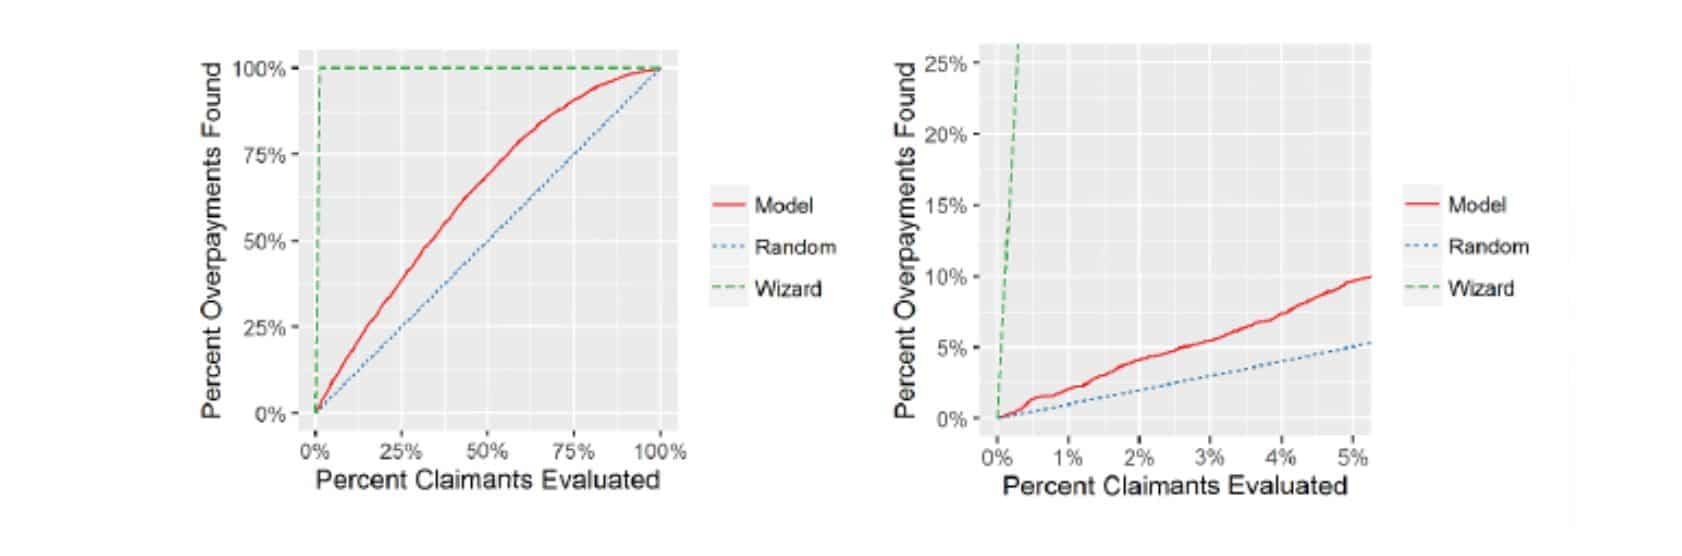
Gain charts are used to assess the performance of this scoring process. Gain charts measure how quickly a model identifies overpayments by charting the percentage of certifications in the validation data set that would need to be examined by subject matter experts (SME) in order to detect a given percentage of the overpayments in the data set. For example, a model that identifies 25% of overpayments after examining only 5% of certifications would be extremely useful – such a model would identify overpayments at five times the baseline rate.
The gain charts contain three lines: the performance of the risk-scoring model (labeled “Model”), the baseline performance (“Random”), and the best performance possible if the model knew exactly which certifications were overpaid (“Wizard”). The charts below reflect a sample of results including one that focuses on the highest-scoring 5% of claimants. The top 5% to 10% of claimants is typically of greatest interest because they represent claims with the highest risk – and are those most worth examining given limited resources. Depending on the deployment, results will vary, and a combination of model tuning and adding other modules can hone results for a specific agency’s requirements.
Delivery
Elder Research built Extract, Load, and Transform (ETL) pipelines to pull the required data from an agency’s data warehouse and prepare it for analytic analysis, and configured RADR to allow analysts to view the results and work cases. The pipelines were automated to pull data on a periodic basis, update the model scores, and push the updates to RADR to provide analysts with fresh case scores. The system was deployed on internal agency servers but could be deployed in a cloud environment as well.
The RADR configuration developed allows investigators to easily view the claim risk scores and can easily be altered to change or add views for a specific need. The current configuration supports several views:
- Claimant Score Listings
- Aggregation of Claimants Across Key Attributes
- Employer
- IP Address
- Phone Number
- Claimant Details
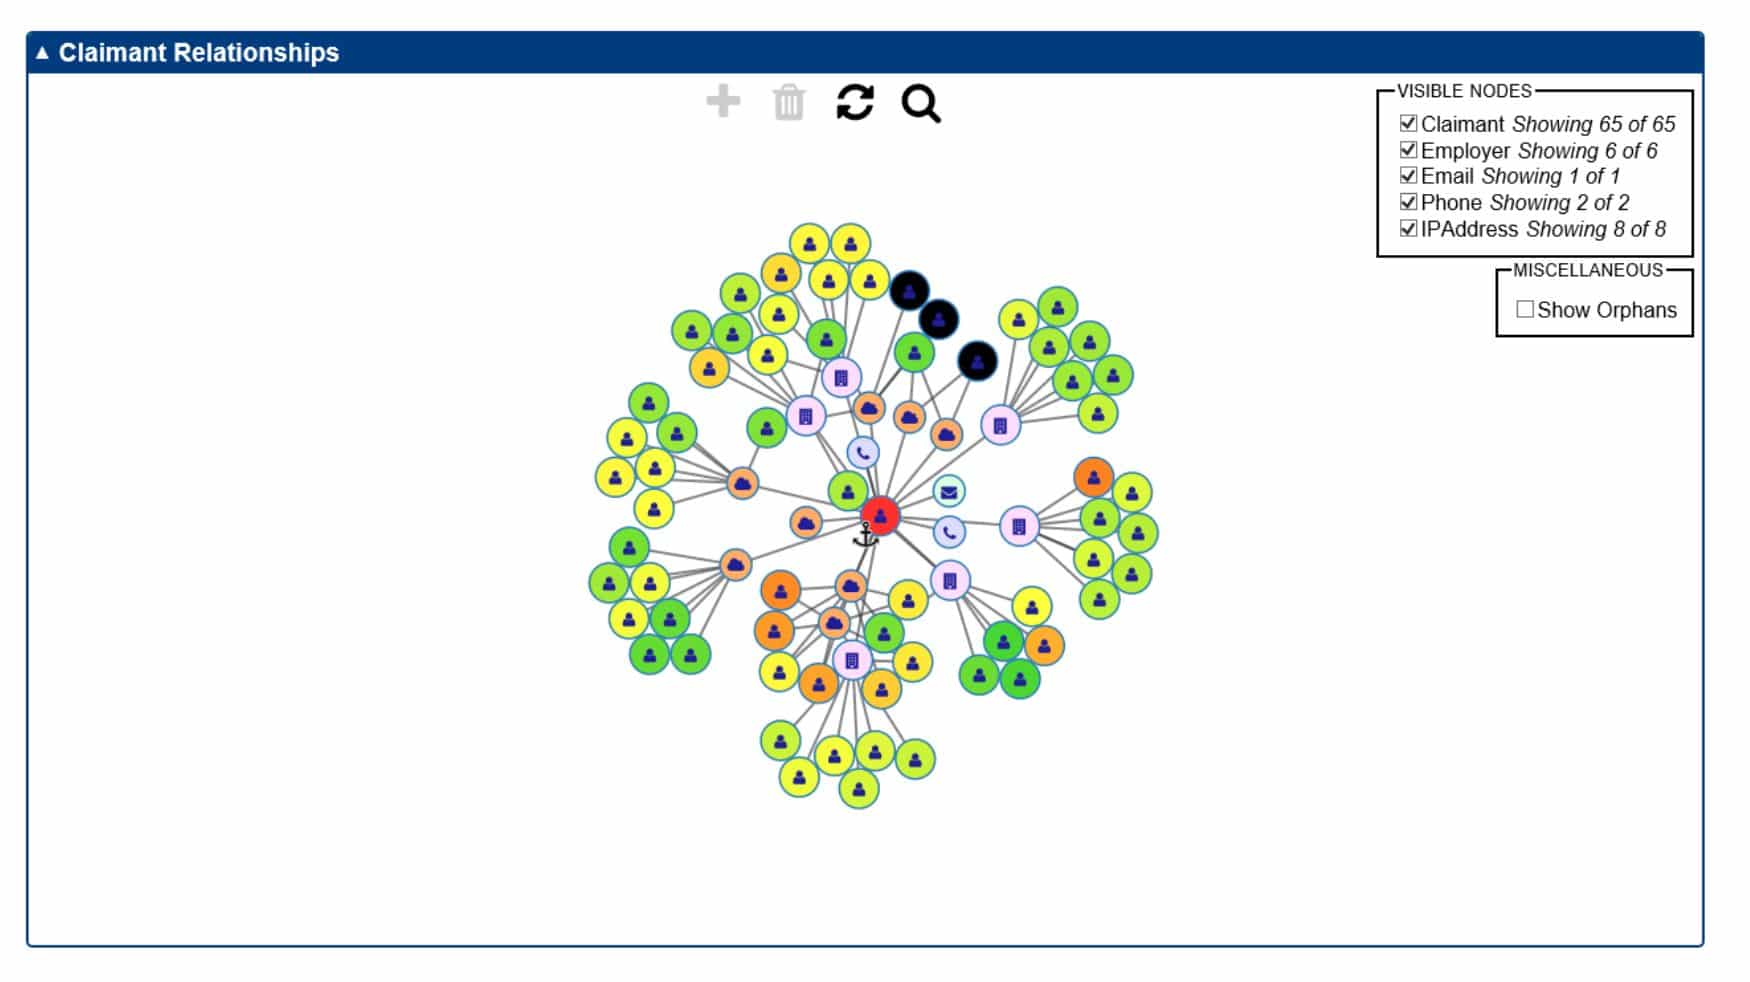
- Includes a graph to associate attributes to other claimants
Claimant Score Listing
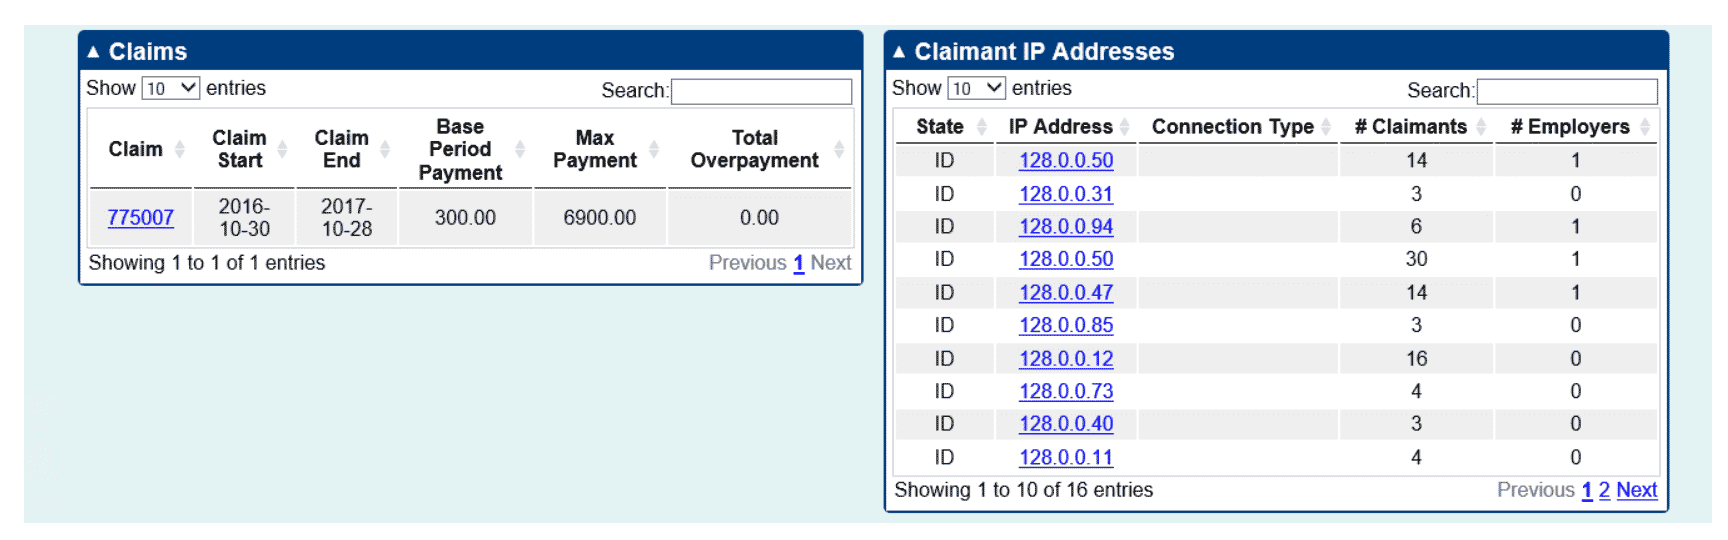
Aggregation – IP Address Example
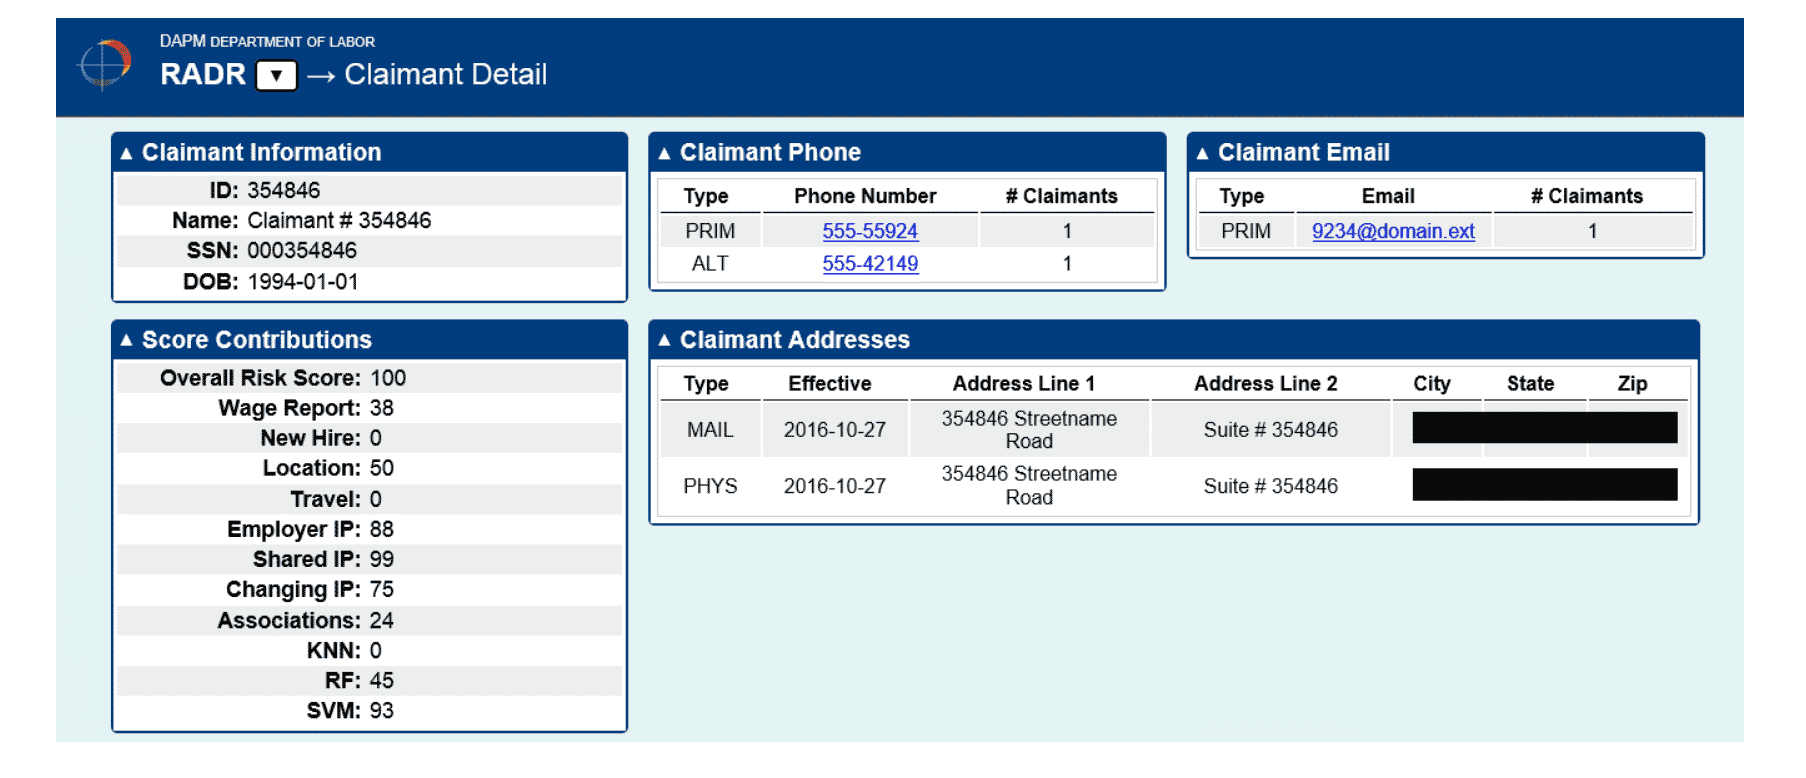
Claimant Detail – Summary
Claimant Detail – Graph
Leveraging DAPM
Given the recent influx of UI claims, we are working with several state agencies to enhance the current deployment and demonstrate how DAPM can improve their analyst’s efficiency. The source code required for implementing the DAPM ETL pipeline and models have been released as open source. While a full implementation will rely on agency-specific data, this solution provides the framework for the pipeline and training. Elder Research can be consulted to support, install and/or augment these models for specific requirements.