Skip to content

Explore Courses | Elder Research | Contact | LMS Login

Statistics.com
  • Curriculum
    • Curriculum
    • About Us
    • Testimonials
    • Management Team
    • Faculty Search
    • Teach With Us
    • Credit & Credentialing
  • Courses
    • Explore Courses
    • Course Calendar
    • About Our Courses
    • Course Tour
    • Test Yourself!
  • Mastery Series
    • Mastery Series Program
    • Bayesian Statistics
    • Business Analytics
    • Healthcare Analytics
    • Marketing Analytics
    • Operations Research
    • Predictive Analytics
    • Python for Analytics
    • R Programming
    • Rasch & IRT
    • Spatial Statistics
    • Statistical Modeling
    • Survey Statistics
    • Text Mining and Analytics
  • Certificates
    • Certificate Program
    • Analytics for Data Science
    • Biostatistics
    • Programming for Data Science – R (Novice)
    • Programming for Data Science – R (Experienced)
    • Programming for Data Science – Python (Novice)
    • Programming for Data Science – Python (Experienced)
    • Social Science
  • Degrees
    • Degree Programs
    • Computational Data Analytics Certificate of Graduate Study from Rowan University
    • Health Data Management Certificate of Graduate Study from Rowan University
    • Data Science Analytics Master’s Degree from Thomas Edison State University (TESU)
    • Data Science Analytics Bachelor’s Degree – TESU
    • Mathematics with Predictive Modeling Emphasis BS from Bellevue University
  • Enterprise
    • Organizations
    • Higher Education
  • Resources
    • Blog
    • FAQs & Knowledge Base
    • Glossary
    • Site Map
    • Statistical Symbols
    • Weekly Brief Newsletter Signup
    • Word of the Week
Menu Close
  • Curriculum
    • Curriculum
    • About Us
    • Testimonials
    • Management Team
    • Faculty Search
    • Teach With Us
    • Credit & Credentialing
  • Courses
    • Explore Courses
    • Course Calendar
    • About Our Courses
    • Course Tour
    • Test Yourself!
  • Mastery Series
    • Mastery Series Program
    • Bayesian Statistics
    • Business Analytics
    • Healthcare Analytics
    • Marketing Analytics
    • Operations Research
    • Predictive Analytics
    • Python for Analytics
    • R Programming
    • Rasch & IRT
    • Spatial Statistics
    • Statistical Modeling
    • Survey Statistics
    • Text Mining and Analytics
  • Certificates
    • Certificate Program
    • Analytics for Data Science
    • Biostatistics
    • Programming for Data Science – R (Novice)
    • Programming for Data Science – R (Experienced)
    • Programming for Data Science – Python (Novice)
    • Programming for Data Science – Python (Experienced)
    • Social Science
  • Degrees
    • Degree Programs
    • Computational Data Analytics Certificate of Graduate Study from Rowan University
    • Health Data Management Certificate of Graduate Study from Rowan University
    • Data Science Analytics Master’s Degree from Thomas Edison State University (TESU)
    • Data Science Analytics Bachelor’s Degree – TESU
    • Mathematics with Predictive Modeling Emphasis BS from Bellevue University
  • Enterprise
    • Organizations
    • Higher Education
  • Resources
    • Blog
    • FAQs & Knowledge Base
    • Glossary
    • Site Map
    • Statistical Symbols
    • Weekly Brief Newsletter Signup
    • Word of the Week

Blog

Home » Blog » Blog Type » Covid-19 » Coronavirus Death Toll

Coronavirus Death Toll

  • April 2, 2020
  • , 3:24 pm

There are tens of thousands of epidemiologists the world over, and we are beginning to see a bumper crop of forecasts for the ultimate 2020 death toll from Covid-19.  It’s a grim but important forecasting task. Most citizens would support draconian measures to prevent deaths in the millions or many hundreds of thousands.  Fewer would support sending the world into serious depression to avoid deaths on the scale of those from car accidents (about 37,000 per year in the US).

Several days ago, President Trump cited a UK study from the Imperial College that forecast up to 2.2 million coronavirus deaths in the US, in the absence of mitigation measures (like social distancing).  A University of Washington model (which has a web interface here) forecasts about 80,000 deaths in the first part of the year. A March 24 Wall Street Journal op-ed by two Stanford doctors, Eran Bendavid and Jay Bhattacharya, “Is the Coronavirus as Deadly as They Say?” suggested the mortality rate might be as low as one-tenth the rate of the flu.

Ensembling…

A time-honored machine learning technique is ensemble learning, or, put simply, averaging various estimates.  Averaging predictions from “weak learners” (models with limited predictive power) usually does better than relying on a single estimate.

Along these lines, Thomas McAndrew and Nicholas Reich have been performing a regular survey of 25 “modeling experts and researchers who have spent a substantial amount of time in their professional career designing, building, and/or interpreting models to explain and understand infectious disease dynamics.”

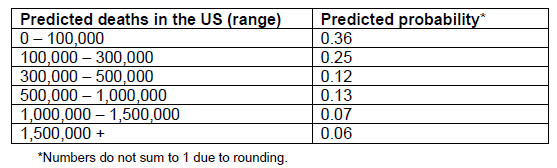
McAndrew and Reich derived a group forecast for a total of 195,000 deaths in the U.S. for 2020.  They’d have been better to put the estimate at 200,000, to avoid conveying a false sense of precision.  The range of estimates among the experts was quite broad (and the methodology for arriving at 195,000 was not stated):  

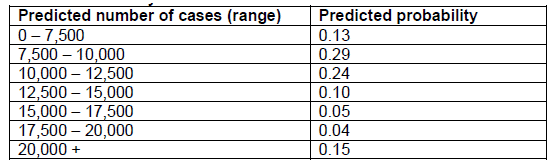
Their ensemble approach for more near-term estimates was, however, quite accurate.  The epidemiologists were asked on March 16/17 to estimate the number of new confirmed cases for a week later, March 23.  The estimates, again, were all over the place:


However, the group ensemble point estimate for new deaths on March 23 was on target:

Estimate from the “epi crowd”    — 10,567

Actual deaths (per worldometer.org)   — 10,189

Summing up

No doubt there will be more models, more estimates, and continuing uncertainty.  Some points to keep in mind:

  • Picking a single model to rely on is probably a mistake, particularly if its output agrees with the chooser’s preconceived (perhaps unconscious) notions
  • The corollary is that better performance is achieved by averaging multiple models
  • It is useful to go back in time and check a model’s earlier forecasts with current data
  • The death rate is a lagging indicator, but may be more reliable than confirmed cases, since the latter depend on testing rates (which can vary widely by jurisdiction)

Finally, for data hounds, here is some interesting detailed data on deaths in New York City by age and pre-existing medical condition.

Subscribe to the Blog

You have Successfully Subscribed!

Categories

Recent Posts

  • Dec 14: Statistics in Practice December 11, 2020
  • PUZZLE OF THE WEEK – School in the Pandemic December 11, 2020
  • From Kaggle to Cancel: The Culture of AI December 11, 2020

About Statistics.com

Statistics.com offers academic and professional education in statistics, analytics, and data science at beginner, intermediate, and advanced levels of instruction. Statistics.com is a part of Elder Research, a data science consultancy with 25 years of experience in data analytics.

Latest Blogs

  • Dec 14: Statistics in Practice
    December 11, 2020/
    0 Comments
  • PUZZLE OF THE WEEK – School in the Pandemic
    December 11, 2020/
    0 Comments
  • From Kaggle to Cancel: The Culture of AI
    December 11, 2020/
    0 Comments

Social Networks

Linkedin
Twitter
Facebook
Youtube

Contact

The Institute for Statistics Education
4075 Wilson Blvd, 8th Floor
Arlington, VA 22203
(571) 281-8817

ourcourses@statistics.com

© Copyright 2021 - Statistics.com, LLC | All Rights Reserved | Privacy Policy | Terms of Use

By continuing to use this website, you consent to the use of cookies in accordance with our Cookie Policy.

Accept