Skip to content

Explore Courses | Elder Research | Contact | LMS Login

Statistics.com
  • Curriculum
    • Curriculum
    • About Us
    • Testimonials
    • Management Team
    • Faculty Search
    • Teach With Us
    • Credit & Credentialing
  • Courses
    • Explore Courses
    • Course Calendar
    • About Our Courses
    • Course Tour
    • Test Yourself!
  • Mastery Series
    • Mastery Series Program
    • Bayesian Statistics
    • Business Analytics
    • Healthcare Analytics
    • Marketing Analytics
    • Operations Research
    • Predictive Analytics
    • Python for Analytics
    • R Programming
    • Rasch & IRT
    • Spatial Statistics
    • Statistical Modeling
    • Survey Statistics
    • Text Mining and Analytics
  • Certificates
    • Certificate Program
    • Analytics for Data Science
    • Biostatistics
    • Programming for Data Science – R (Novice)
    • Programming for Data Science – R (Experienced)
    • Programming for Data Science – Python (Novice)
    • Programming for Data Science – Python (Experienced)
    • Social Science
  • Degrees
    • Degree Programs
    • Computational Data Analytics Certificate of Graduate Study from Rowan University
    • Health Data Management Certificate of Graduate Study from Rowan University
    • Data Science Analytics Master’s Degree from Thomas Edison State University (TESU)
    • Data Science Analytics Bachelor’s Degree – TESU
    • Mathematics with Predictive Modeling Emphasis BS from Bellevue University
  • Enterprise
    • Organizations
    • Higher Education
  • Resources
    • Blog
    • FAQs & Knowledge Base
    • Glossary
    • Site Map
    • Statistical Symbols
    • Weekly Brief Newsletter Signup
    • Word of the Week
Menu Close
  • Curriculum
    • Curriculum
    • About Us
    • Testimonials
    • Management Team
    • Faculty Search
    • Teach With Us
    • Credit & Credentialing
  • Courses
    • Explore Courses
    • Course Calendar
    • About Our Courses
    • Course Tour
    • Test Yourself!
  • Mastery Series
    • Mastery Series Program
    • Bayesian Statistics
    • Business Analytics
    • Healthcare Analytics
    • Marketing Analytics
    • Operations Research
    • Predictive Analytics
    • Python for Analytics
    • R Programming
    • Rasch & IRT
    • Spatial Statistics
    • Statistical Modeling
    • Survey Statistics
    • Text Mining and Analytics
  • Certificates
    • Certificate Program
    • Analytics for Data Science
    • Biostatistics
    • Programming for Data Science – R (Novice)
    • Programming for Data Science – R (Experienced)
    • Programming for Data Science – Python (Novice)
    • Programming for Data Science – Python (Experienced)
    • Social Science
  • Degrees
    • Degree Programs
    • Computational Data Analytics Certificate of Graduate Study from Rowan University
    • Health Data Management Certificate of Graduate Study from Rowan University
    • Data Science Analytics Master’s Degree from Thomas Edison State University (TESU)
    • Data Science Analytics Bachelor’s Degree – TESU
    • Mathematics with Predictive Modeling Emphasis BS from Bellevue University
  • Enterprise
    • Organizations
    • Higher Education
  • Resources
    • Blog
    • FAQs & Knowledge Base
    • Glossary
    • Site Map
    • Statistical Symbols
    • Weekly Brief Newsletter Signup
    • Word of the Week

Density (of Probability)

Density (of Probability)

Density Functions:

A probability density function or curve is a non-negative function Math image ( Math image ) that describes the distribution of a continuous random variable Math image . If Math image is known, then the probability Math image that a value of the variable Math image is within an interval Math image is described by the following integral
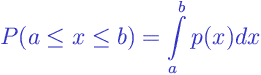
For very small intervals Math image , where Math image is a small value, the relation is simpler:

The reason for using probability density instead of probability itself is the following: Continuous variables, in contrast to discrete random variables cannot be described by the probability of particular values of Math image because there are infinitely many possible values and they are not countable. This makes the probability of any particular value equal to zero. For example, the probability that the body weight of an individual is exactly Math image kilogram is practically zero, but the probability that body weight is within the interval Math image kg is a measurable quantity.

Note that the probability density function is the curve itself, and the probability is the area under the curve.

See also: joint probability density , marginal density , and short course Basic Concepts in Probability and Statistics .

Browse Other Glossary Entries

Courses Using This Term

Return to Glossary Search

About Statistics.com

Statistics.com offers academic and professional education in statistics, analytics, and data science at beginner, intermediate, and advanced levels of instruction. Statistics.com is a part of Elder Research, a data science consultancy with 25 years of experience in data analytics.

Latest Blogs

  • Making Predictions Self-Fulfilling Prophecies
    February 19, 2021/
    0 Comments
  • Student Spotlight – Staci Taylor
    February 18, 2021/
    0 Comments
  • Word of the Week:  Bias
    February 1, 2021/
    0 Comments

Social Networks

Linkedin
Twitter
Facebook
Youtube

Contact

The Institute for Statistics Education
4075 Wilson Blvd, 8th Floor
Arlington, VA 22203
(571) 281-8817

ourcourses@statistics.com

© Copyright 2021 - Statistics.com, LLC | All Rights Reserved | Privacy Policy | Terms of Use

By continuing to use this website, you consent to the use of cookies in accordance with our Cookie Policy.

Accept