Skip to content
Statistics logo
  • Courses
    • See All Courses
    • Calendar
    • Intro stats for college credit
    • Faculty
    • Group training
    • Credit & Credentialing
    • Teach With Us
  • Programs/Degrees
    • Certificates
      • Analytics for Data Science
      • Biostatistics
      • Programming For Data Science – Python (Experienced)
      • Programming For Data Science – Python (Novice)
      • Programming For Data Science – R (Experienced)
      • Programming For Data Science – R (Novice)
      • Social Science
    • Skillsets
      • Bayesian Statistics
      • Business Analytics
      • Healthcare Analytics
      • Marketing Analytics
      • Operations Research
      • Predictive Analytics
      • Python Analytics
      • R Programming Analytics
      • Rasch & IRT
      • Spatial Statistics
      • Survey Analysis
      • Text Mining Analytics
    • Undergraduate Degree Programs
    • Graduate Degree Programs
  • Partnerships
    • Higher Education
    • Enterprise
  • Resources
    • About Us
    • Blog
    • Word Of The Week
    • Newsletter signup
    • Glossary
    • Statistical Symbols
    • FAQs & Knowledge Base
    • Testimonials
    • Test Yourself
  • Student Login

Home Blog May 5: Statistics in Practice

May 5: Statistics in Practice

In this week’s Brief, we look deeper into the question of whether Covid-19 is a senior citizen disease.  Our course spotlight is twofold:

  • Start in May or June:  Mastery in Statistical Modeling (3 courses)
  • June 12 to July 10  Analyzing and Modeling Covid-19 Data

See you in class!

– Peter Bruce

Founder, Author, and Senior Scientist


Coronavirus: Age and Health

Although you read in the news of young people dying from Covid, the disease in its serious form is overwhelmingly a disease of older people.  Might this be simply because older people have more health issues?  Read on for the answer […]


Word of the Week

Decision Stumps

A decision stump is a decision tree with just one decision, leading to two or more leaves.  Decision stumps are used in […]


Historical Spotlight

Miasma

As more information arrives about the Coronavirus, researchers point more and more to airborne particles and aerosols as the mechanism of spread.  Photographic images of a sneeze, such as […]

Sneeze
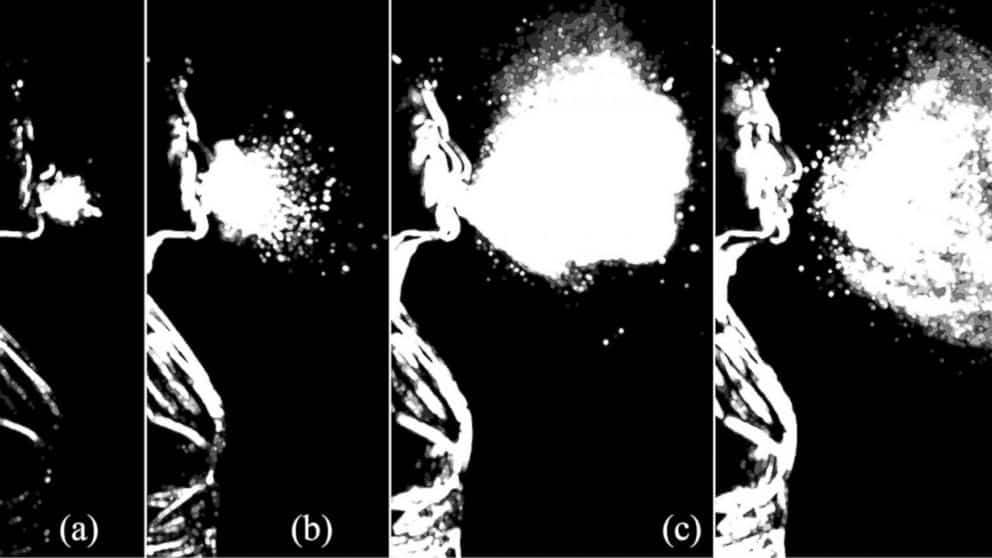
IMAGES BY LYDIA BOUROUIBA, MIT


Course Spotlight

Gain a Mastery in Statistical Modeling – you choose 3 courses

  • Regression Analysis (starts May 8)
  • Generalized Linear Models (starts June 19)
  • Count Data Modeling (starts Oct. 23)
  • Modeling in R (starts July 3)
  • Mixed and Hierarchical Linear Models (Starts Sept 25)

Analyzing and Modeling Covid-19 Data (June 12 to July 10)

We’ll cover analysis of Covid data broadly, and focus on the epidemiological and statistical models used to forecast the spread of the pandemic. In this seminar-style course for statistically-literate* researchers, you will

  • Explore key rates and features of the Coronavirus data
  • Learn how to specify epidemiological models
  • Learn how to fit statistical models
  • The strengths and weaknesses of each type of model

The instructors are

  • James Hardin, Epidemiology and Biostatistics Associate Professor and Associate Dean for Faculty Affairs and Curriculum for the Arnold School of Public Health, University of South Carolina.
  • Wayne Folta a Lead Data Scientist at Elder Research, Inc. where he develops and deploys models for clients. His current work involves the design and implementation of text mining and deep learning models at the U.S. Dept. of Health and Human Services; he has also been active within Elder Research in exploring and assessing epidemiological models in R.

See you in class!


Digital Badges

Regression Analysis

Digital badges provide employers and peers concrete evidence of what you have learned and the skills required to earn your credential. Each badge’s digital image holds verified metadata describing your qualifications and the mastery required to earn them.


Contact Us To Learn More

If you have any questions on our courses, certificates, and degree programs and how they can apply to you, your work, and to your career, please get in touch. We’re here to help you succeed.

Subscribe to the Blog

You have Successfully Subscribed!

By submitting your information, you agree to receive email communications from statistics.com. All information submitted is subject to our privacy policy. You may opt out of receiving communications at any time.

Categories

Recent Posts

  • Table Test
  • Oct 19: Data Literacy – The Chainsaw Case
  • Data Literacy – The Chainsaw Case

About Statistics.com

Statistics.com offers academic and professional education in statistics, analytics, and data science at beginner, intermediate, and advanced levels of instruction. Statistics.com is a part of Elder Research, a data science consultancy with 25 years of experience in data analytics.

Our Links

  • Contact Us
  • Site Map
  • Explore Courses
  • About Us
  • Management Team
Menu
  • Contact Us
  • Site Map
  • Explore Courses
  • About Us
  • Management Team

Social Networks

Linkedin-in Twitter Facebook-f Youtube

Contact

The Institute for Statistics Education
2107 Wilson Blvd
Suite 850 
Arlington, VA 22201
(571) 281-8817

ourcourses@statistics.com

  • Contact Us
  • Site Map
  • Explore Courses
  • About Us
  • Management Team

© Copyright 2022 - Statistics.com, LLC | All Rights Reserved | Privacy Policy | Terms of Use

By continuing to use this website, you consent to the use of cookies in accordance with our Cookie Policy.

Accept