Convinced that he, like his father, would die in his 40’s, Winston Churchill lived his early life in a frenetic hurry. He had participated in four wars on three continents by his mid-20’s, served in multiple ministerial positions by his 30’s, and published 12 books by his 40’s. Little did he know that more than a decade of eclipse would ensue, followed by his brightest years in World War II, and survival to age 90.
How long someone or something will last is the subject of survival analysis:
-
How long will a cancer stay in remission?
-
How long will a streaming video subscriber, or a credit card holder, remain a customer?
-
How long will a fuel pump last?
These examples cover medicine, ecommerce and engineering. The first development of survival analysis came in biostatistics (hence the term survival). The following basic presentation draws on the excellent self-learning text Survival Analysis by David Kleinbaum (who developed the Statistics.com course in Survival Analysis, and also the Epidemiologic Statistics course and the Designing Valid Studies course).
The basic building block is a plot where the y-axis represents proportion surviving, and the x-axis represents time.
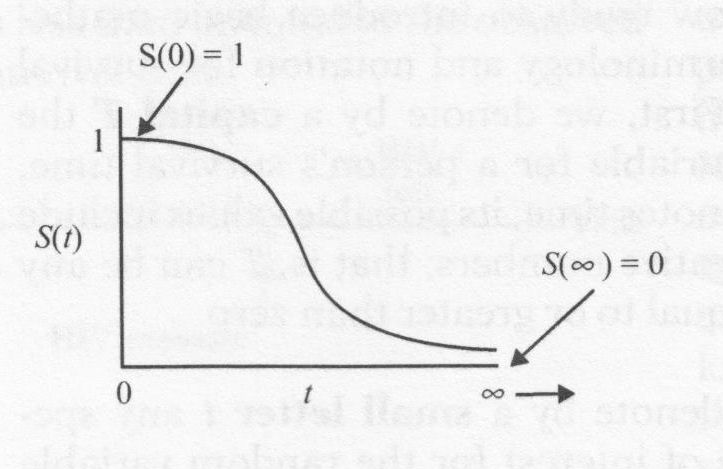
The survivor function S(t) gives the probability that a patient (or customer or device or component) will survive longer than a specified time (t). A related concept is the hazard function, which Kleinbaum describes as the potential for failing at time t. Without getting too mathematical, we can say it is the probability of dying or failing in some very tiny interval of time, divided by that time interval. S(t) and h(t) are convertible to one another – if you know one, you can derive the other.
Censoring
An important concept in survival analysis is censoring, where the full time to failure is not observed. A patient who is still surviving at the end of a study period, or a customer who is still a subscriber, is considered censored – their true survival time is not known. Or patients may leave a study midstream for personal reasons. This type of censoring is termed right censoring because the survival curve is cut off on the right hand side. A subject may also be left censored. Consider subscription durations for a company’s streaming service, where some customers came to the company when the company acquired a similar service from a competitor and switched them over to its own service. The acquiring company may not have data on when the customer signed up with the original company, and can only track survival from the point they have data. Both forms of censoring represent complications for analysis; right-censoring receives the most attention.
Predictors (Covariates)
So far we have considered plots and functions that describe the average behavior for a study group. The heart of survival analysis adds additional variables to the mix so we can get a more precise idea of survival prospects for an individual. The purpose of the analysis may differ:
-
Medical researchers and engineers are interested in analyzing the effect of different predictor variables on survival (medical researchers call these variables covariates).
-
Medical researchers are also interested in the effect of treatments on survival, in which case other predictor variables are included to isolate the treatment effect from the effect of these other covariates (which are not necessarily of interest themselves).
-
Data scientists are usually less interested in studying the effects of predictor variables, and more interested in the specific survival predictions for individuals (for example, so that customers at risk of leaving, also called churning, might be given special offers).
Complexity
Survival analysis has some complexity to it due to the fact that we are dealing with data over time. The basic model is the Cox Proportional Hazard model, with variations and other methods to deal with complications like
-
The data are likely to be censored
-
The effect of predictors may differ over time
-
We might be interested in events that can recur (e.g. multiple heart attacks)
-
We might be interested in two or more terminal event causes (e.g. heart attack or stroke) that we want to disentangle
Survival analysis has grown in scope and popularity – originating in medicine, quickly adapted for engineering, and spreading recently to marketing. It is a broad and deep methodology, and learning it can be challenging – it is important to keep in mind what the goal is of your analysis. In particular, if you are a data scientist interested in prediction, remember that much of the nomenclature and methodology of survival analysis derives from medicine, where the goal is analyzing covariate effect, and isolating treatment effect.