There are various metrics for assessing the performance of a classification model. It matters which one you use. The simplest is accuracy – the proportion of cases correctly classified. In classification tasks where the outcome of interest (“1”) is rare, though, accuracy as a metric falls short – high accuracy can be achieved by classifying everything as a “0.” Here are three alternatives:
- The Receiver Operating Characteristics (ROC) curve is widely used, as its associated metric AUC (area under the curve). This curve plots recall (% of 1’s correctly classified, called sensitivity in the medical sciences) on the y-axis and specificity (% of 0’s correctly classified) on a reversed x-axis. A near-perfect model – one that correctly identified nearly all the 1’s correctly then nearly all the 0’s – would have an ROC curve that hugs the upper left corner, and it would have an AUC of nearly 1. Read more here.
 Often the business goal is not to classify every case, but rather to do a good job in identifying the 1’s without capturing too many 0’s, so we focus on the cases most likely to be 1’s. For example, a direct marketer wants to expend effort on reaching only the most probable purchasers, and an insurance investigator wants to spend time on the likeliest frauds.
- Gains, and the gains chart (or cumulative gains chart), measure the number of 1’s captured on the y-axis (or the total value, if the model is predicting a numerical quantity) as you move along the count of records on the y-axis, arrayed left to right in order of decreasing probability of being a 1 (or decreasing predicted value). It looks like the ROC curve, but it does not generate an overall measure of model performance like the AUC. It does, however, measure units that more directly relate to business goals than do recall and specificity.
- Lift is like gains, except that it measures not the actual counts of the 1’s (or the total predicted value), but rather the ratio of that count or value to the baseline count/value that you would achieve by selecting randomly.
Lift and gains are often presented, for visual clarity, in a decile chart. This allows the direct marketer, for example, or the fraud analyst, to easily consider the implications of actions for conveniently-sized groups of customers.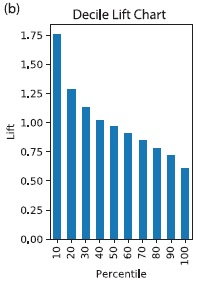
The x-axis represents cases ranked by probability and grouped into deciles with the bar on the left representing the decile with the highest probability of being a 1 (or, in the case of predicting numeric values, the highest predicted value). The y-axis is the ratio of that decile’s counts of 1’s (or predicted value) to the average count or value across all deciles.