Benford’s Law states that, given a conforming data set, the first significant digit is a “1” about 30% of the time – 6 times more often than it’s a 9. The phenomenon, which is quite widespread, is named after physicist Frank Benford, who illustrated it with the surface areas of rivers, street addresses, numbers appearing in a Reader’s Digest issue, and many more examples. Accountants, for example, use it in forensic review of accounting statements to iscover fraud.
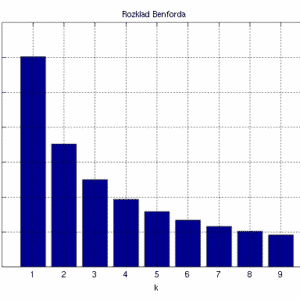
The graph shows the expected frequency of each digit as the initial digit in a conforming data set – the left bar represents “1”, which occurs 30% of the time, the next bar “2”, at almost 18% of the time, and so on.
In 2014, a University of Maryland professor, Dr. Jen Golbeck, who teaches Statistics.com’s Network Analysis course, published a very interesting and timely application of Benford’s Law. She found that the number of friends on Facebook or Twitter users follows Benford’s Law. So if you looked at (say) 1000 Facebook users and counted how many friends each had, roughly 300 of them would have friend counts in the teens (1x), 100-199 range (1xx) or 1000 – 1999 range (1xxx). Only 5% would have counts beginning with a nine – 9, 90-99, 900-999, 9000 – 9999. She showed that this information could be used to identify fake accounts, where the distribution of “friends of friends” turns out to depart significantly from Benford’s law. In other words, for an account in question, you would consider each friend of that account, and count the number of friends that friend has. The distribution of those counts turns out not to follow Benford’s Law for fake accounts.