Predicting the probability that something or someone will belong to a certain category (classification problems) is perhaps the oldest type of problem in analytics. Consider the category “repays loan.” Equifax, the oldest of the agencies that provides credit scores, was founded in 1899 as the Retail Credit Company by two brothers, Cator and Guy Woolford. They built and maintained a list of customers and their credit-worthiness, and sold access to their list to other businesses. In the 1950’s, Bill Fair and Earl Isaac standardized and automated a credit reporting system that assigned potential borrowers a score that was, in effect, a predicted probability (propensity) that they would repay a loan. Over time, credit reporting systems came to incorporate predictive models that were trained with actual customer repayment data.
Other scenarios use scores that represent the probability of an outcome of interest (typically binary):
- Fraud or not
- Churn or not (subscription)
- Buy or not
- Click or not
In assessing models for credit scoring and some of these other applications, we can measure the model’s accuracy (the proportion of classifications it gets right). A widely-recognized metric in the data science community is the Receiver Operating Characteristics curve (ROC curve), which measures the model’s overall ability to separate classes. This curve plots recall (% of 1’s correctly classified, called sensitivity in the medical sciences) on the y-axis and specificity (% of 0’s correctly classified) a reversed x-axis. A nearly universal metric derived from the ROC is the “area under the curve” or AUC. A near-perfect model – one that correctly identified nearly all the 1’s correctly then nearly all the 0’s – would have an ROC curve that hugs the upper left corner and an AUC of nearly 1.
But is AUC the best metric? It treats all bits of area under the curve equally, but it is often the case that misclassification costs are not the same for 1’s and 0’s. In targeting prospective customers, missing a $1000 customer carries a bigger cost than expending minor effort on reaching a value-less customer. There are other metrics better suited to these situations with asymmetric costs or benefits.
Lift/Gains
An older metric for model performance is lift (gains). It grew out of the direct mail industry, which itself dates from the mid-1800’s. Direct mail has always appealed to statisticians because of the opportunity it affords to conduct controlled experiments and measure individual consumer response, rather than relying on intuition or industry lore. The same predictive models that were used for credit scores were applied to direct marketing, which initially meant direct mail (and now includes digital marketing).
In credit scoring, the task is to develop a score for any given prospective borrower, so a bank or other institution can make a lending decision on that borrower. In direct mail, the task is to develop scores for each of many names on a mailing list, so that a marketer can limit its advertising to customers with a high enough predicted probability of purchase, or profit.
In the direct marketing situation, we are interested only in a subset of the data – the subset that optimizes response or profit. To assess model performance, therefore, we need a metric that handles the data incrementally; model performance on the whole list is of minimal interest. Put another way, we want a metric that will help us skim the cream off the top. That metric is lift (gains).
Lift is the boost that you get from using a predictive model compared to the baseline scenario of selecting randomly, defined for a specified portion of the data. For example, a decile lift chart for a direct response mail campaign might look like this:
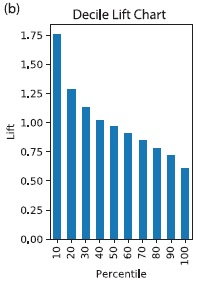
Interpretation: After the data are sorted by predicted probability of response, the top 10% are 1.75 times more likely to respond than is a randomly-selected record.
The term gains typically refers to cumulative response counts or totals while lift refers to the ratio compared to baseline, though the two are sometimes used interchangeably.
Incorporating Costs and Benefits
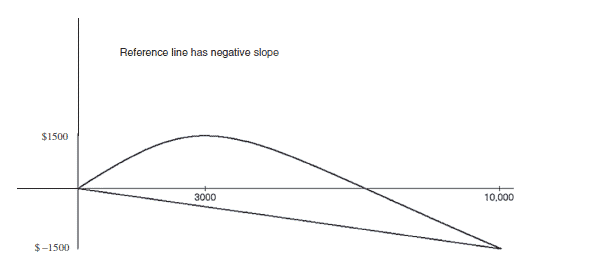
Often we want to go beyond response or no response, and incorporate costs and benefits. It is entirely possible for a reference line that incorporates costs and benefits to have a negative slope if the net value for the entire dataset is negative. For example, if the cost of mailing to a person is $0.65, the value of a responder is $25, and the overall response rate is 2%, the expected net value of mailing to a full list of 10,000 is (0.02 x $25 x 10,000) – ($0.65 x 10,000) = $5000 – $6500 = -$1500. Hence, the cumulative y-value (profit) at the far right of the lift curve (x = 10,000 people mailed to) is -$1500, and the slope of the reference line from the origin will be negative. The optimal point will be where the cumulative gains curve is at a maximum (i.e. mailing to about 3000 people).
Direct mail may seem old-fashioned (though it continues to flourish), but it makes for a good example because costs and benefits can be so precisely specified. However, the principle of incorporating costs and benefits holds in many situations. For example, in reviewing tax returns, or insurance claims, time and resources may be limited so comparing the cost of review and the benefit from locating fraud is useful in deciding which returns or claims should be looked at. After ranking claims by the probability of fraud, you would likely set a cutoff that maximizes net expected benefit subject to the resource constraint.
Uplift and Persuasion
The goal of any direct mail campaign, or other messaging effort, is to persuade somebody to do something. In the business world, it is usually to buy something. In the political world, it is usually to vote for someone. In such a case, our interest may go beyond “which people should we mail to,” and include “what message should we send to which people?” Uplift models address the latter question, which we will address in our next blog. Issues of uplift and persuasion are addressed in Persuasion Analytics and Targeting .