Famous Mistakes in Statistics
“A little knowledge is a dangerous thing,” said Alexander Pope in 1711; he could have been speaking of the use of statistics by experts in all fields. In this article, we look at three consequential mistakes in the field of statistics. Two of them are famous, the third required a deep dive into the corporate annual reports of a U.S. software company.
1. The Truth About Sex
Albert Kinsey’s Sexual Behavior in the Human Male was published in 1948 and, though it was a relatively dry, 800-page scientific work chock full of statistics and tables, it quickly made the national best-seller list. Among its stunning (at the time) findings was that 10% of adult men were homosexuals, and an additional 11% were bisexual. 37% had had at least one homosexual experience. The book generated considerable controversy, and was followed several years later by a similar report on women.
Kinsey’s work was challenged by statisticians and is a good example of a case where big data are not necessarily better data. Kinsey interviewed roughly 5,300 men and 6,000 women in his research, but he followed no clear sampling methodology. His 10% estimate for male homosexuals became widely reported and used, but it turned out to be a wild over-estimate. Among the cohort that would have been adults at the time of Kinsey’s research, recent data show that the number self-identifying as LGBT has been consistently less than 2%.
Where did Kinsey go wrong?
Most likely, the problem lay in his sampling procedures. He did not lay out any definitive sampling methodology and seemed to have proceeded by convenience and by tapping into groups that were accessible (e.g. his students, and prison populations). Gathering information from readily available sources is a fine technique for getting started on a study, to identify possible questions to ask and hypotheses to probe. But convenience sampling, as this is known, is not a good way to make a sensitive quantitative estimate. It is a process prone to bias and inaccuracy. Investigator perspective guides who is surveyed and thus becomes part of the data. The chain process by which subjects refer other subjects over-weights some of the data. Perhaps more important is “volunteer bias,” the bias that occurs when only those who volunteer their information are included. It can be especially strong when dealing with highly sensitive or personal subjects.
The controversy aroused by the Kinsey report brought the American Statistical Association into the picture: a committee of distinguished statisticians (F. Mosteller, G. W. Cochran, J. Tukey, and W. Jenkins) issued a report that concluded:
“…many of the most interesting and provocative statements in the book are not based on the data presented therein, and it is not made clear to the reader on what evidence the statements are based. … Taken cumulatively, these objections amount to saying that much of the writing in the book falls below the level of good scientific writing.”
Moral of the story:
Collecting good data in an unbiased fashion is more important than collecting a lot of data.
2. Almost Bankrupting the Company…
In 1993, Mathsoft Corp., the developer of Mathcad mathematical software, acquired StatSci, the developer of S-PLUS statistical software. Mathcad was an affordable tool popular with engineers: prices were in the hundreds of dollars and the number of users was in the hundreds of thousands. S-PLUS was a high-end graphical and statistical tool used primarily by statisticians: prices were in the thousands of dollars and the number of users was in the thousands.
In looking to boost revenues, Mathsoft turned to an established marketing principle: cross-selling. In other words, try to convince the people who bought product A to buy product B. With the acquisition of a highly-regarded niche product, S-PLUS, and an existing large customer base for Mathcad, Mathsoft decided that the logical thing to do would be to ramp up S-PLUS sales via direct mail to its installed Mathcad user base. It also decided to purchase lists of similar prospective customers for both Mathcad and S-PLUS.
This major mailing program was a bust. It boosted revenues, but it boosted expenses even more, to the point where they threatened the company’s future. The company lost over $13 million in 1993 and 1994 combined—significant numbers for a company that had only $11 million in 1992 revenue.
What happened?
In retrospect, it was clear that the mailings were not well targeted. The costs of the unopened mail exceeded the revenue from the few recipients who did respond. In particular, Mathcad users turned out not to be likely users of S-PLUS. The huge losses could have been avoided through the use of two common statistical techniques:
- Doing a test mailing to the various lists being considered to (a) determine whether the list is productive and (b) test different headlines, copy, pricing, etc., to see what works best.
- Using predictive modeling techniques to identify which names on a list are most likely to turn into customers.
Moral of the story:
Even a company built on statistical algorithms is prone to non-statistical thinking.
Epilogue:
In 2008, Tibco, makers of Spotfire, acquired Mathsoft. S-PLUS’s last release was in 2010; it was displaced by its open-source clone: R.
3. The Challenger Disaster
Perhaps the most famous catastrophe in which statistics played a part was the 1986 disintegration of the Challenger space shuttle over the Atlantic, which killed all 7 crew members. The cause of the break-up was the failure of an O-ring joint, which allowed hot pressurized gases to escape and destroy the structural connections among the shuttle’s rocket boosters and fuel tank. Owing to the low temperature at launch (39 degrees Fahrenheit), the O-ring had lost the elasticity it needed to adapt to launch stress and maintain a seal.
The possible failure of the O-ring at low temperature had been discussed and debated before the launch. Indeed, there had been non-catastrophic O-ring failures previously. The following scatterplot of launch temperature (x-axis) versus O-ring failures per flight (y-axis) was reviewed by a team of engineers:
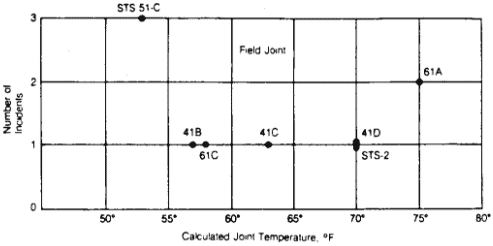
The team concluded that there was no relationship between launch temperature and the number of O-ring incidents on a flight. An investigation after the disaster characterized the team’s view as
“Temperature data not conclusive on primary O-ring blow-by.”
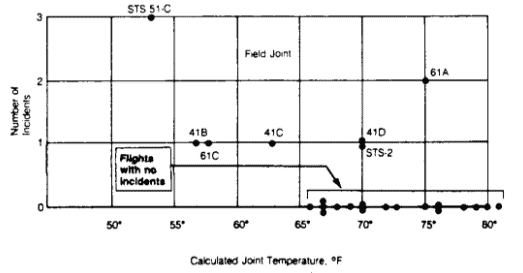
This analysis looked only at the flights where incidents did occur, it left out the flights where failures did not occur. When you add in the latter, a different picture emerges. All the flights with no incidents occurred at temperatures above 65 degrees; all the flights below that temperature did have incidents. Clearly there is a relationship between temperature and O-ring failure. The Challenger flight was launched at a temperature of 39 degrees – the coldest ever.
Moral of the story:
Look at all the relevant data – don’t pick and choose.