A casual user of machine learning methods like CART or naive Bayes is accustomed to evaluating a model by measuring how well it predicts new data. When examining the output of statistical models, they are often flummoxed by the profusion of assessment metrics. Typical multiple linear regression output will contain, in addition to a distribution of errors (residuals) and RMSE (root mean squared error), such values as R-squared, adjusted R-squared, t-statistics, F-statistics, P-values, degrees of freedom, at a minimum, plus more.
Statistical methods like linear regression long predate the era of big data so
- they have had lots of time to accumulate many different model assessment metrics, and
- these metrics typically focus on how well the model fits the data it was trained with.
To make sense of things, it helps to have in mind the different possible goals of modeling:
- Description
- Explanation
- Prediction
Modeling for description aims at a compact representation of relationships in data, e.g. what’s happened with sales in the last two years. Modeling for explanation is similar, but it is used by researchers to develop causal evidence in support of a formal theory (say, in economics, behavioral science, medicine, business, etc.). Modeling for prediction is typically indifferent to an underling explanatory model, but is interested only in predicting values for new data.
Which goal do you have in mind? What difference does it make in doing the modeling?
Cutting through the metric noise
If you are evaluating a predictive model, you probably want to stay focused on the goal of the model, which is prediction. This means concentrating on the metrics that matter, measures of accuracy, most likely with holdout data not used in the model. RMSE for measured outcomes, percent error for binary outcomes, AUC, and lift would all be relevant.
P-values, t-statistics, and F-statistics, by contrast, all relate to the somewhat arcane world of statistical inference, and pertain to the data the model was trained with, not new data. R-squared relates more directly to model fit, but also is typically calculated on the data the model was trained with. These metrics are potentially distracting and may obscure the predictive task, which can hinder useful interaction with others in the organization.
Getting a better model
So when would it make sense to extend your focus beyond accuracy metrics? There are a couple of approaches to improving model performance. One is to experiment with the data and see which modeling technique (trees, naive Bayes, linear or logistic regression, etc.) performs the best, and with which settings (variable transformations, interactions, parameters for tree growth, etc.). Another is to go back to the domain experts and improve the data used in modeling – seeking additional explanatory variables. For example, if prediction errors differ for different ranges of the predicted value (i.e heteroskedasticity is present), that is an indication that something is missing from the model.
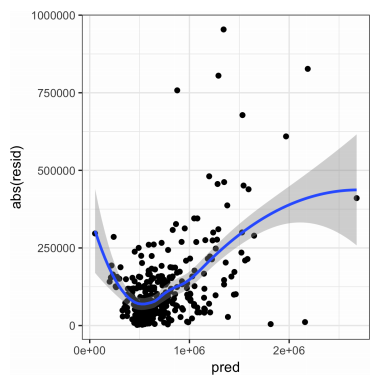
For example, here is a plot of predicted home values (x-axis) versus errors in those predictions (y-axis), with a curve superimposed. The plot shows higher residuals at the low and high ends of the predicted value scale, indicating that the predictive model may have left something unaccounted for in low and high range homes.
Which predictors to use?
In prediction, you have to be careful about excluding predictors that will not be available with new data. In explanatory modeling, these predictors can be used. Also, in explanatory modeling, the predictor variables should have some connection to the conceptual or theoretical framework that you are exploring.
Want to dive deeper into this whole issue of prediction versus explanation (and description)? Check out Galit Shmueli’s article on the subject in Statistical Science.